

Test-retest reliability and four-week changes in cardiopulmonary fitness in stroke patients: evaluation using a robotics-assisted tilt table
- PMID: 27600918
- PMCID: PMC5012058
- DOI: 10.1186/s12883-016-0686-0
Test-retest reliability and four-week changes in cardiopulmonary fitness in stroke patients: evaluation using a robotics-assisted tilt table
Abstract
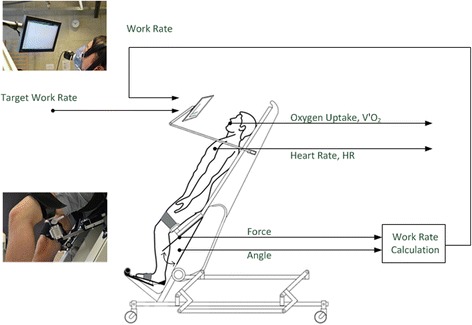
Background: Exercise testing devices for evaluating cardiopulmonary fitness in patients with severe disability after stroke are lacking, but we have adapted a robotics-assisted tilt table (RATT) for cardiopulmonary exercise testing (CPET). Using the RATT in a sample of patients after stroke, this study aimed to investigate test-retest reliability and repeatability of CPET and to prospectively investigate changes in cardiopulmonary outcomes over a period of four weeks.
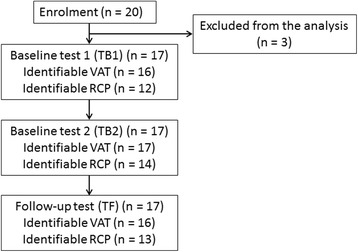
Methods: Stroke patients with all degrees of disability underwent 3 separate CPET sessions: 2 tests at baseline (TB1 and TB2) and 1 test at follow up (TF). TB1 and TB2 were at least 24 h apart. TB2 and TF were 4 weeks apart. A RATT equipped with force sensors in the thigh cuffs, a work rate estimation algorithm and a real-time visual feedback system was used to guide the patients' exercise work rate during CPET. Test-retest reliability and repeatability of CPET variables were analysed using paired t-tests, the intraclass correlation coefficient (ICC), the coefficient of variation (CoV), and Bland and Altman limits of agreement. Changes in cardiopulmonary fitness during four weeks were analysed using paired t-tests.
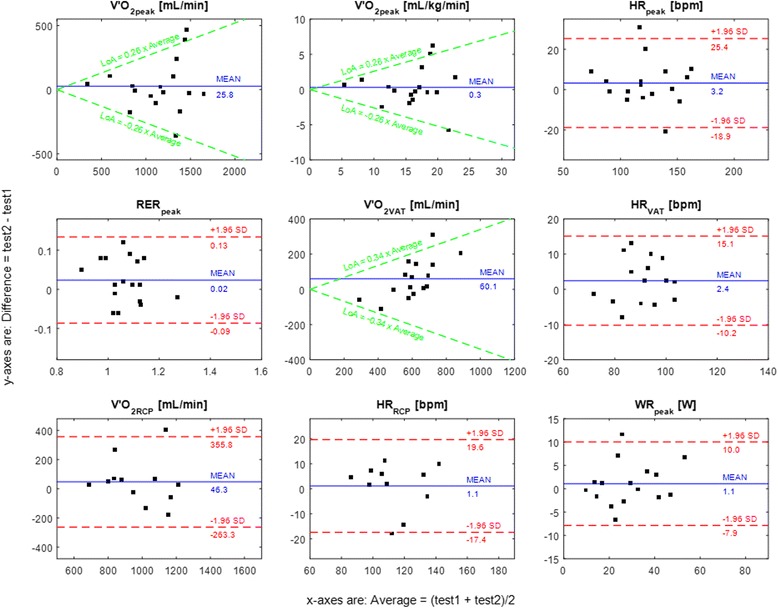
Results: Seventeen sub-acute and chronic stroke patients (age 62.7 ± 10.4 years [mean ± SD]; 8 females) completed the test sessions. The median time post stroke was 350 days. There were 4 severely disabled, 1 moderately disabled and 12 mildly disabled patients. For test-retest, there were no statistically significant differences between TB1 and TB2 for most CPET variables. Peak oxygen uptake, peak heart rate, peak work rate and oxygen uptake at the ventilatory anaerobic threshold (VAT) and respiratory compensation point (RCP) showed good to excellent test-retest reliability (ICC 0.65-0.94). For all CPET variables, CoV was 4.1-14.5 %. The mean difference was close to zero in most of the CPET variables. There were no significant changes in most cardiopulmonary performance parameters during the 4-week period (TB2 vs TF).
Conclusions: These findings provide the first evidence of test-retest reliability and repeatability of the principal CPET variables using the novel RATT system and testing methodology, and high success rates in identification of VAT and RCP: good to excellent test-retest reliability and repeatability were found for all submaximal and maximal CPET variables. Reliability and repeatability of the main CPET parameters in stroke patients on the RATT were comparable to previous findings in stroke patients using standard exercise testing devices. The RATT has potential to be used as an alternative exercise testing device in patients who have limitations for use of standard exercise testing devices.
Keywords: Cardiopulmonary exercise testing; Repeatability; Robotics-assisted tilt table; Stroke; Test-retest reliability.
Figures
Similar articles
-
Submaximal cardiopulmonary thresholds on a robotics-assisted tilt table, a cycle and a treadmill: a comparative analysis.Biomed Eng Online. 2015 Nov 10;14:104. doi: 10.1186/s12938-015-0099-0. Biomed Eng Online. 2015. PMID: 26555762 Free PMC article.
-
Cardiopulmonary exercise testing early after stroke using feedback-controlled robotics-assisted treadmill exercise: test-retest reliability and repeatability.J Neuroeng Rehabil. 2014 Oct 11;11:145. doi: 10.1186/1743-0003-11-145. J Neuroeng Rehabil. 2014. PMID: 25306061 Free PMC article. Clinical Trial.
-
Feasibility of cardiopulmonary exercise testing and training using a robotics-assisted tilt table in dependent-ambulatory stroke patients.J Neuroeng Rehabil. 2015 Sep 26;12:88. doi: 10.1186/s12984-015-0078-5. J Neuroeng Rehabil. 2015. PMID: 26410821 Free PMC article.
-
Test-retest reliability of the 30-15 Intermittent Fitness Test: A systematic review.J Sport Health Sci. 2021 Jul;10(4):413-418. doi: 10.1016/j.jshs.2020.04.010. Epub 2020 May 15. J Sport Health Sci. 2021. PMID: 32422345 Free PMC article.
-
[Guidance to the Interpretation of Cardiopulmonary Exercise Testing].Pneumologie. 2020 Feb;74(2):88-102. doi: 10.1055/a-1069-0611. Epub 2020 Feb 12. Pneumologie. 2020. PMID: 32050280 Review. German.
Cited by
-
Feedback control of heart rate during robotics-assisted tilt table exercise in patients after stroke: a clinical feasibility study.J Neuroeng Rehabil. 2024 Aug 12;21(1):141. doi: 10.1186/s12984-024-01440-8. J Neuroeng Rehabil. 2024. PMID: 39135048 Free PMC article.
-
Unilateral Arm Crank Exercise Test for Assessing Cardiorespiratory Fitness in Individuals with Hemiparetic Stroke.Biomed Res Int. 2017;2017:6862041. doi: 10.1155/2017/6862041. Epub 2017 Dec 31. Biomed Res Int. 2017. PMID: 29457034 Free PMC article.
-
Development and evaluation of a novel system for inducing orthostatic challenge by tilt tests and lower body negative pressure.Sci Rep. 2018 May 17;8(1):7793. doi: 10.1038/s41598-018-26173-2. Sci Rep. 2018. PMID: 29773912 Free PMC article.
-
Cardiopulmonary Response to Robot-Assisted Tilt Table With Regard to Its Components.Brain Neurorehabil. 2023 Mar 31;16(1):e9. doi: 10.12786/bn.2023.16.e9. eCollection 2023 Mar. Brain Neurorehabil. 2023. PMID: 37033003 Free PMC article.
-
A Single Bout of Constant-Load Exercise Test for Estimating the Time Constant of Oxygen Uptake Kinetics in Individuals With Stroke.Ann Rehabil Med. 2021 Aug;45(4):304-313. doi: 10.5535/arm.21087. Epub 2021 Aug 30. Ann Rehabil Med. 2021. PMID: 34496473 Free PMC article.
References
MeSH terms
LinkOut - more resources
Full Text Sources
Other Literature Sources
Medical
Miscellaneous
