. 2016 Dec;30(12):4141-4148.
doi: 10.1096/fj.201600816R. Epub 2016 Sep 6.

Decreased synaptic proteins in neuronal exosomes of frontotemporal dementia and Alzheimer's disease

Affiliations

Decreased synaptic proteins in neuronal exosomes of frontotemporal dementia and Alzheimer's disease

Edward J Goetzl et al. FASEB J. 2016 Dec.

Abstract

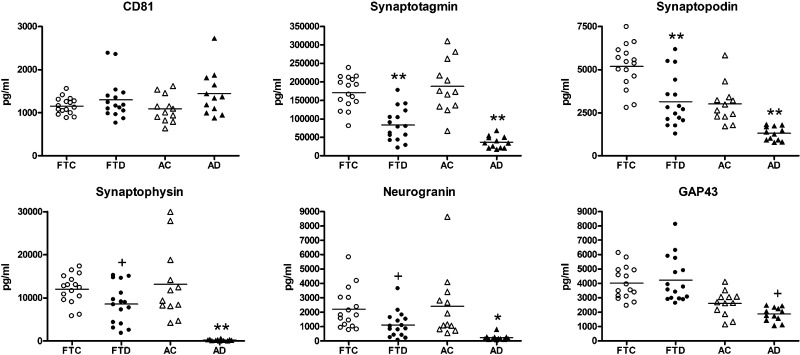
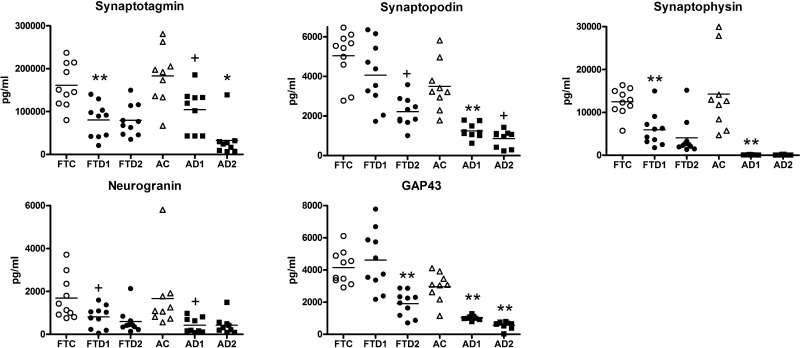
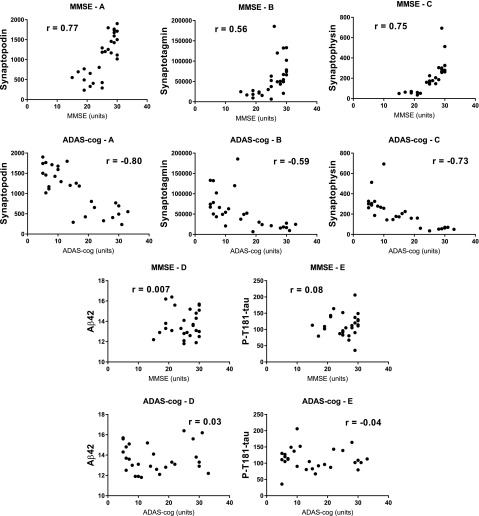
Synaptic dysfunction occurs early in senile dementias, presumably as a result of decreased levels of functional synaptic proteins as found in autopsied brains of patients with Alzheimer's disease (AD) or frontotemporal dementia (FTD). Plasma neuronal-derived exosomes (NDEs) were recovered by precipitation and immunoabsorption from 12 patients with AD, 16 with FTD, and 28 controls in a cross-sectional study, and from 9 patients with AD, 10 with FTD, and 19 controls in a longitudinal study. Six synaptic proteins in NDE extracts were quantified by ELISAs and normalized for exosome amounts. NDE levels of synaptophysin, synaptopodin, synaptotagmin-2, and neurogranin were significantly lower in patients with FTD and AD than in controls, but those of growth-associated protein 43 and synapsin 1 were reduced only in patients with AD. Functionally relevant phosphorylation of synapsin 1 serine 9 was reduced in patients with FTD and AD, although total synapsin 1 protein was higher in FTD than in controls. NDE levels of synaptotagmin, synaptophysin, and neurogranin were decreased years before dementia in patients with FTD and AD. NDE levels of synaptopodin, synaptotagmin, and synaptophysin, but not of amyloid β-peptide 42 or P-T181-tau, were correlated significantly with cognition assessed by mini-mental state examination or AD assessment scale-cognitive subscale. NDE synaptic proteins may be useful preclinical indices and progression measures in senile dementias.-Goetzl, E. J., Kapogiannis, D., Schwartz, J. B., Lobach, I. V., Goetzl, L., Abner, E. L., Jicha, G. A., Karydas, A. M., Boxer, A., Miller, B. L. Decreased synaptic proteins in neuronal exosomes of frontotemporal dementia and Alzheimer's disease.

Keywords: biomarkers; cognition; neurotransmission; proteinopathy.


Figures

Figure 1.
Figure 1.
Levels of plasma NDE synaptic proteins in cross-sectional studies of FTD and AD. Each point in a frame depicts the value for a single subject, and the horizontal line among points represents the mean value for that group. Subject group abbreviations and the meaning of statistical symbols are the same as in Table 1. Statistical symbols above FTD and AD points show the significance level of differences from their respective control groups. Means ± sem for synaptotagmin, synaptopodin, synaptophysin, neurogranin, and GAP43, respectively, were as follows: FTC: 171,116 ± 10,876; 5178 ± 321; 12,009 ± 841; 2208 ± 354; and 4019 ± 282; FTD: 83,307 ± 11,154; 3145 ± 372; 8541 ± 1157; 1117 ± 227; and 4515 ± 630; AC: 187,650 ± 20,480; 3808 ± 333; 13,148 ± 2417; 2413 ± 658; and 2607 ± 250; AD: 36,555 ± 4682; 1299 ± 116; 240 ± 47.1; 232 ± 56.5; and 1863 ± 140. All differences between AD and FTD groups in values of synaptotagmin, synaptopodin, synaptophysin, neurogranin, and GAP43 were significant at respective P values of 0.0019, 0.0003, <0.0001, 0.0052, and 0.0014. +P < 0.05; *P < 0.01; **P < 0.001.
Figure 2.
Figure 2.
Levels of plasma NDE synaptic proteins in longitudinal studies of FTD and AD. Points, subject group abbreviations, and the meaning of statistical symbols are the same as in Table 1 and Fig. 1. Statistical symbols above FTD1 and AD1 values show the significance level of differences from their respective control groups, FTC and AC, whereas symbols above FTD2 and AD2 values show significant differences from the corresponding FTD1 and AD1 groups. Mean ± sem for synaptotagmin, synaptopodin, synaptophysin, neurogranin, and GAP43, respectively, were as follows: FTC: 161,039 ± 16,113; 5043 ± 402; 12,469 ± 989; 1690 ± 322; and 4149 ± 328; FTD1: 80,256 ± 12,829; 4067 ± 511; 5902 ± 1238; 810 ± 164; and 4608 ± 593; FTD2: 79,507 ± 11,569; 2216 ± 235; 3157 ± 661; 596 ± 182; and 3319 ± 237; AC: 183,214 ± 21,994; 3491 ± 417; 14,427 ± 2906; 1691 ± 537; and 2960 ± 301; AD1: 104,296 ± 16,898; 1250 ± 126; 95.5 ± 11.6; 459 ± 129; and 1034 ± 47.4; AD2: 32,622 ± 13,711; 857 ± 142; 95.3 ± 25.1; 430 ± 144; and 570 ± 78.2. Differences between AD2 and FTD2 groups in values of synaptotagmin, synaptopodin, synaptophysin, neurogranin, and GAP43 showed significance with respective P values of 0.0175, 0.0002, 0.0004, not significant, and <0.0001. +P < 0.05; *P < 0.01; **P < 0.001.
Figure 3.
Figure 3.
Correlations of MMSE and ADAS-cog cognitive function values with NDE synaptic protein levels, but not of primary neurotoxic proteins in AD. MMSE frames show significant correlations between MMSE and synaptopodin (MMSE-A; P < 0.001), synaptotagmin (MMSE-B; P = 0.002), and synaptophysin (MMSE-C; P < 0.001), but not Aβ42 (MMSE-D; P = 0.97) or P-T181-tau (MMSE-E; P = 0.70). ADAS-cog frames show significant correlations between ADAS-cog and synaptopodin (ADAS-cog-A; P < 0.001), synaptotagmin (ADAS-cog-B; P = 0.009), and synaptophysin (ADAS-cog-C; P < 0.001), but not Aβ42 (ADAS-cog-D; P = 0.86) or P-T181-tau (ADAS-cog-E; P = 0.82). All protein analyte concentrations are given as picograms per milliliter after normalization with the corresponding level of CD81.

References

    1. Kalia M. (2008) Brain development: anatomy, connectivity, adaptive plasticity, and toxicity. Metabolism 57, S2–S5 - PubMed
    1. Tau G. Z., Peterson B. S. (2010) Normal development of brain circuits. Neuropsychopharmacology 35, 147–168 - PMC - PubMed
    1. Selkoe D. J. (2002) Alzheimer’s disease is a synaptic failure. Science 298, 789–791 - PubMed
    1. Clare R., King V. G., Wirenfeldt M., Vinters H. V. (2010) Synapse loss in dementias. J. Neurosci. Res. 88, 2083–2090 - PMC - PubMed
    1. DeKosky S. T., Scheff S. W. (1990) Synapse loss in frontal cortex biopsies in Alzheimer’s disease: correlation with cognitive severity. Ann. Neurol. 27, 457–464 - PubMed

Publication types