. 2016 Dec;30(12):4083-4097.
doi: 10.1096/fj.201600430R. Epub 2016 Sep 6.

The endoplasmic reticulum remains functionally connected by vesicular transport after its fragmentation in cells expressing Z-α1-antitrypsin

Affiliations

The endoplasmic reticulum remains functionally connected by vesicular transport after its fragmentation in cells expressing Z-α1-antitrypsin

Jennifer A Dickens et al. FASEB J. 2016 Dec.

Abstract

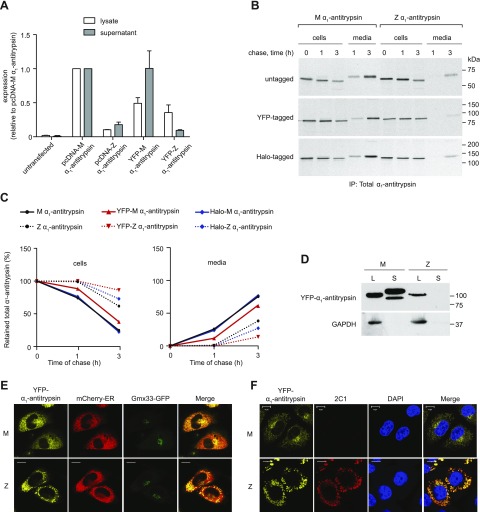
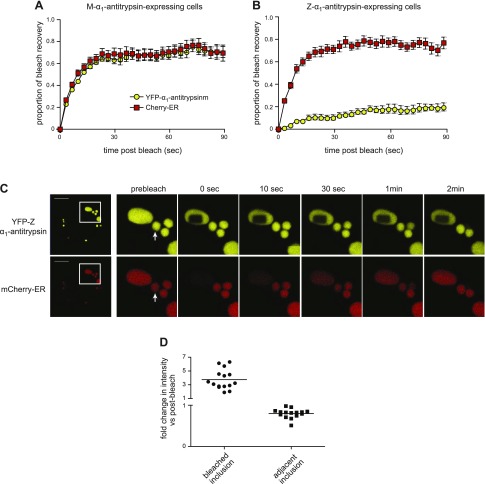
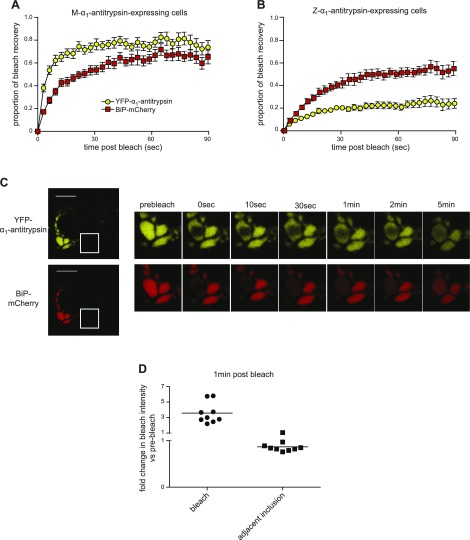
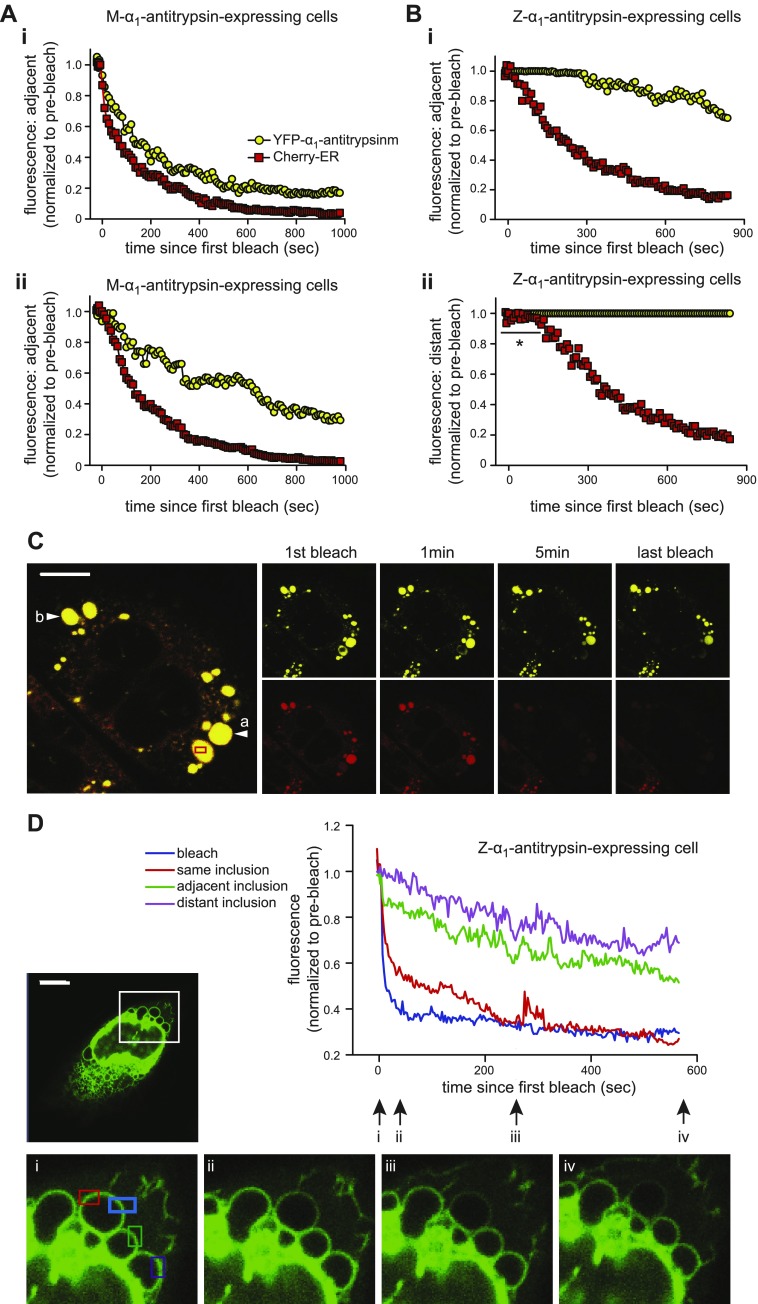
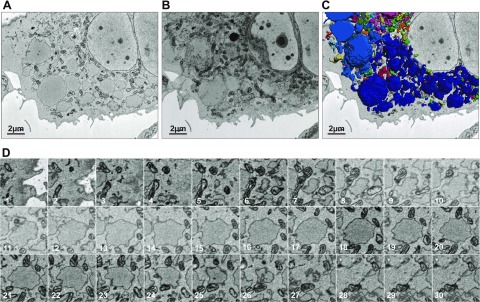
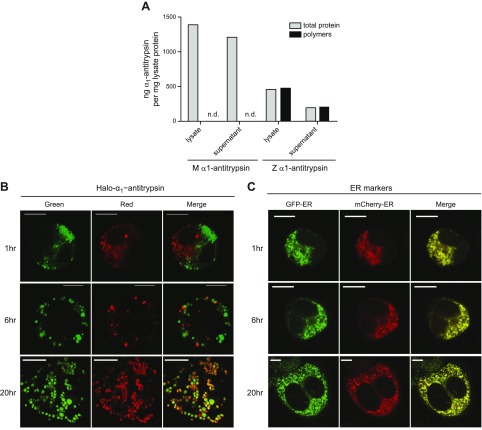
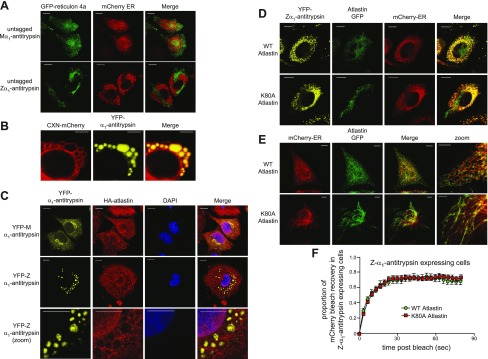
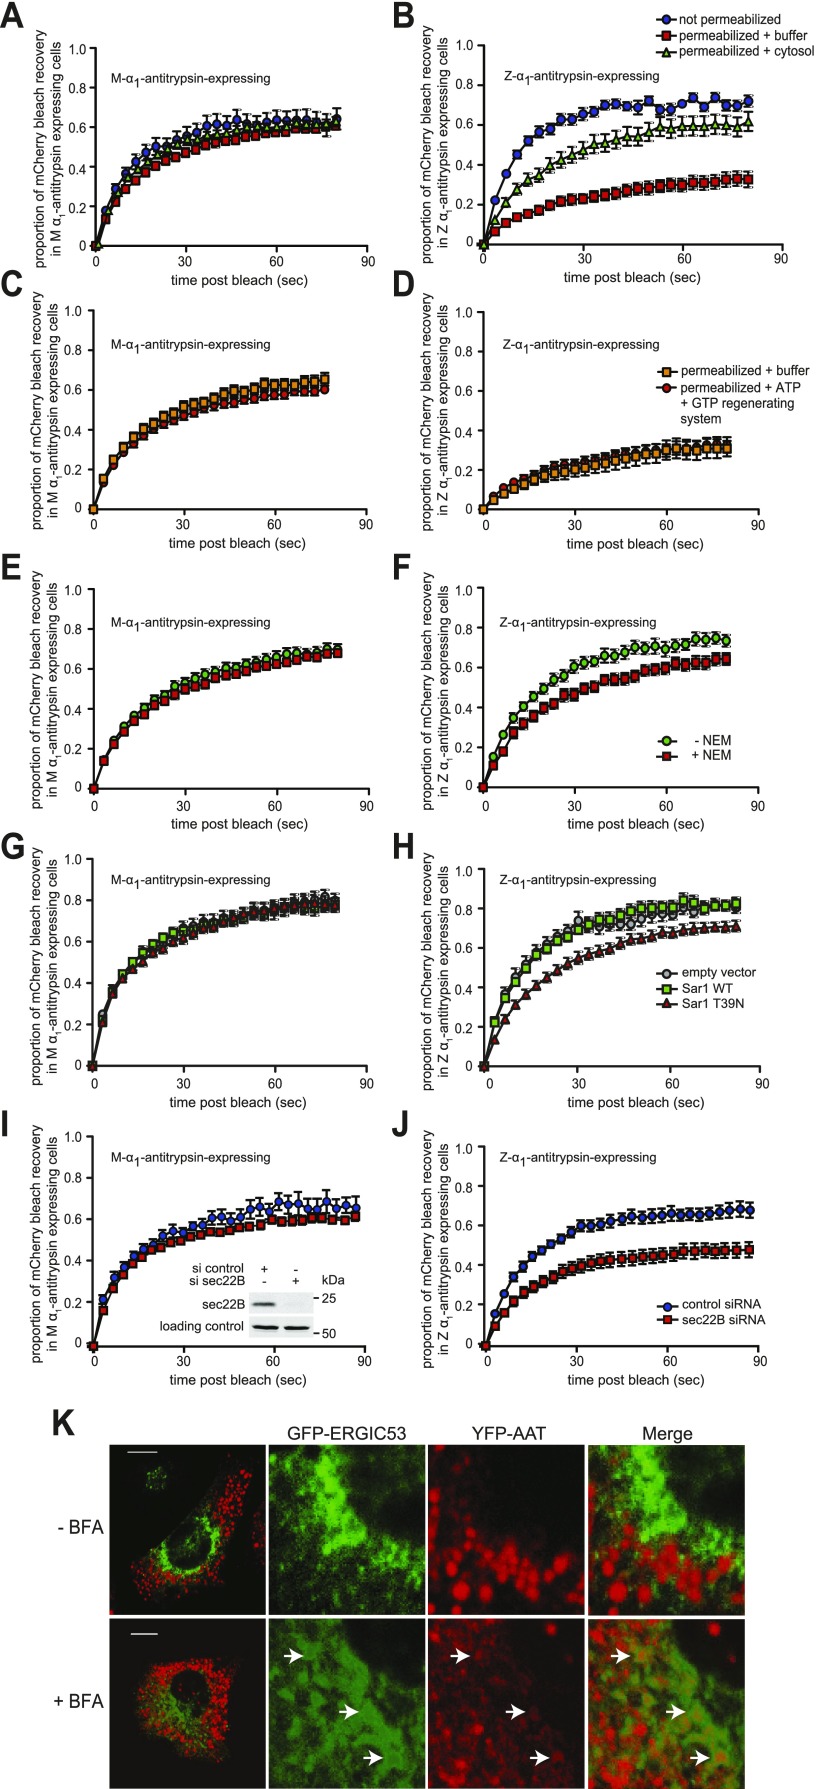
α1-Antitrypsin is a serine protease inhibitor produced in the liver that is responsible for the regulation of pulmonary inflammation. The commonest pathogenic gene mutation yields Z-α1-antitrypsin, which has a propensity to self-associate forming polymers that become trapped in inclusions of endoplasmic reticulum (ER). It is unclear whether these inclusions are connected to the main ER network in Z-α1-antitrypsin-expressing cells. Using live cell imaging, we found that despite inclusions containing an immobile matrix of polymeric α1-antitrypsin, small ER resident proteins can diffuse freely within them. Inclusions have many features to suggest they represent fragmented ER, and some are physically separated from the tubular ER network, yet we observed cargo to be transported between them in a cytosol-dependent fashion that is sensitive to N-ethylmaleimide and dependent on Sar1 and sec22B. We conclude that protein recycling occurs between ER inclusions despite their physical separation.-Dickens, J. A., Ordóñez, A., Chambers, J. E., Beckett, A. J., Patel, V., Malzer, E., Dominicus, C. S., Bradley, J., Peden, A. A., Prior, I. A., Lomas, D. A., Marciniak, S. J. The endoplasmic reticulum remains functionally connected by vesicular transport after its fragmentation in cells expressing Z-α1-antitrypsin.

Keywords: ER stress; SNARE; homotypic fusion; serpin.


Figures

Figure 1.
Figure 1.
Characterization of YFP-α1-antitrypsin. A) CHO cells were transfected with untagged (pcDNA) or YFP-tagged M-α1-antitrypsin or Z-α1-antitrypsin. Whole-cell lysates and supernatants were analyzed for total α1-antitrypsin production by sandwich ELISA (n = 3). B) CHO cells expressing untagged α1-antitrypsin, YFP-α1-antitrypsin, or HaloTag-α1-antitrypsin were pulse labeled with [35S]-Met/Cys for 15 min and chased for 0 to 3 h. Alpha-1-antitrypsin from Triton X-100 cell lysates and medium was immunoprecipitated with polyclonal antibody; samples were then resolved by 10% SDS-PAGE and detected by autoradiography. C) Quantification of retained (left) and secreted (right) α1-antitrypsin reveal comparable profiles of untagged and tagged protein. D) Western blot of cell lysates (L) and medium supernatants (S) from YFP-α1-antitrypsin CHOs show band of expected size for YFP-α1-antitrypsin fusion protein. Lower-mobility mature glycoform of α1-antitrypsin is visible only in YFP-M-α1-antitrypsin-conditioned medium. E) CHO cells cotransfected with YFP-α1-antitrypsin (yellow), mCherry-ER (red), and Golgi marker Gmx33-GFP (green). YFP-M-α1-antitrypsin colocalized with both ER and Golgi markers, whereas YFP-Z-α1-antitrypsin accumulated in punctate inclusions labeled with ER marker and failed to colocalize with Golgi marker. Scale bars, 10 µm. F) CHO cells were transiently transfected with YFP-α1-antitrypsin, fixed, labeled with 2C1 antibody, and analyzed by immunofluorescence microscopy. Positive 2C1 staining indicative of pathogenic polymer formation was observed only in cells expressing YFP-Z-α1-antitrypsin. Scale bars, 10 µm.
Figure 2.
Figure 2.
Inclusions contain gel-like material through which small proteins can move. A, B) CHO cells were cotransfected with YFP-α1-antitrypsin and mCherry-ER; simultaneous 2-color FRAP was then performed using region of interest 5–10% cross-sectional area of cell: YFP-M-α1-antitrypsin (A), YFP-Z-α1-antitrypsin (B). mCherry fluorescence (red squares) recovered rapidly in both YFP-M-α1-antitrypsin and YFP-Z-α1-antitrypsin-expressing cells, whereas fluorescence of YFP-Z-α1-antitrypsin (yellow circles) recovered more slowly than that of YFP-M-α1-antitrypsin. For YFP-Z-α1-antitrypsin-expressing cells, number of inclusions was included within bleached area. C) Two-color FRAP was performed with region of interest sufficiently small to lie within one large inclusion. Area of bleached YFP-Z-α1-antitrypsin persists more than 2 min; however, mCherry fluorescence was completely bleached within inclusion but recovered during 2 min, while adjacent inclusions partially dimmed. Scale bars, 10 µm. Adjacent inclusion used for quantitation (D) is indicated with arrow. D) Quantification of mCherry fluorescence intensity in bleached vs. adjacent inclusion 30 s after bleaching (relative to immediate postbleaching intensity).
Figure 3.
Figure 3.
Mobility of ER chaperone BiP is retarded in Z-α1-antitrypsin-expressing cells. CHO cells coexpressing BiP-mCherry and either YFP-M-α1-antitrypsin (A) or YFP-Z-α1-antitrypsin (B) were subjected to 2-color FRAP. Retardation of recovery of BiP-mCherry fluorescence (red squares) was noted in YFP-Z-α1-antitrypsin vs. YFP-M-α1-antitrypsin-expressing cells (P < 0.0001). C) Two-color FRAP was performed with region of interest sufficiently small to lie within one large inclusion. Area of bleached YFP-Z-α1-antitrypsin persists for more than 2 min. BiP-mCherry fluorescence was completely bleached within inclusion but began to recover during 5 min, while adjacent inclusions partially dimmed. Scale bars, 10 µm. D) Quantification of BiP-mCherry fluorescence intensity in bleached vs. adjacent inclusion 1 min after bleaching relative to immediate postbleaching intensity.
Figure 4.
Figure 4.
Neither lumens nor membranes of inclusions are connected. A) FLIP in CHO cells expressing M-α1-antitrypsin (yellow circles) and mCherry-ER (red squares). Single region of interest of 5–10% area of cell was bleached repetitively, and fluorescence of each fluorophore was measured at adjacent (6 µm) (i) and distant (40 µm) (ii) sites within cell. Both mCherry and YFP fluorescence was immediately lost throughout cell. B) FLIP of CHO cells expressing YFP-Z-α1-antitrypsin (yellow circles) and mCherry-ER (red squares). Region of interest within single inclusion was repetitively bleached, and fluorescence was measured in adjacent (i) and distant (ii) inclusion. Delay was present before loss of YFP-Z-α1-antitrypsin fluorescence from adjacent inclusion (i) vs. persistence of fluorescence in distant inclusion (ii). Marked delay (indicated with an asterisk) was noted before loss of mCherry-ER fluorescence from distant inclusion (ii). C) Representative images of YFP-Z-α1-antitrypsin photobleaching experiment: bleaching region of interest (red box); adjacent inclusion (arrow a), distant inclusion (arrow b). Scale bar, 10 µm. D) FLIP of cells expressing untagged Z-α1-antitrypsin and ER membrane marker cytERM-msfGFP. Graph illustrates cytERM-msfGFP fluorescence at bleached area (blue); 2 equidistant regions of interest, one on same inclusion (red); one on adjacent inclusion (green); and another on distant inclusion (purple). Inset: whole cell and 4 high-powered views of bleaching area at times i to iv marked on graph. Scale bar, 10 µm.
Figure 5.
Figure 5.
There is no evidence of interinclusion luminal connectivity by electron microscopy. A, B) Inclusion-laden CHO cell transfected with YFP-Z-α1-antitrypsin and selected using fluorescence microscopy was subjected to serial block-face scanning electron microscopy, single scan (A), and 3-D reconstruction (B). C) Peripheries of Z-α1-antitrypsin-containing inclusions were imaged using Gatan 3View system and combined using Imaris software to generate 3-D projection by isosurface rendering with surface area detail of 36 nm. D) Serial block-face scanning electron microscopy images through inclusion of Z-α1-antitrypsin. Lack of interinclusion luminal connectivity is evident.
Figure 6.
Figure 6.
Inclusion contents can be exchanged despite physical separation. A) CHO cells were transfected with HaloTag-M-α1-antitrypsin or HaloTag-Z-α1-antitrypsin. Whole-cell lysates and supernatants were analyzed for total α1-antitrypsin and polymer production by sandwich ELISA using polymer-specific 2C1 antibody. Only HaloTag-Z-α1-antitrypsin expressing cells are able to produce polymers. B) CHO cells were transfected with HaloTag-Z-α1-antitrypsin for 24 h, then stained either with TMR (red) or Oregon Green (green). Cells were washed, mixed, and electrofused, then replated and fixed at 1, 6, and 20 h. Colocalization of red- and green-stained HaloTag-Z-α1-antitrypsin occurred only after 20 h electrofusion. C) CHO cells were cotransfected with untagged Z-α1-antitrypsin and either GFP-ER (green) or mCherry-ER (red) for 24 h. Cells were mixed, electrofused, and replated, then fixed at 1, 6, and 20 h. Colocalization of GFP-ER or mCherry-ER-labeled inclusions occurred after only 1 h of electrofusion. Scale bars, 10 µm.
Figure 7.
Figure 7.
Transport between inclusions is insensitive to dominant negative atlastin. A) Lack of colocalization of GFP–reticulon 4a and mCherry-ER: CHO cells were cotransfected with untagged M- or Z-α1-antitrypsin, GFP–reticulon 4a (green) and mCherry-ER (red). Reticular pattern is evident of GFP–reticulon 4a and mCherry-ER in M-α1-antitrypsin-expressing cells, in contrast to lack of colocalization between tubular GFP–reticulon 4a and punctate mCherry-ER in Z-α1-antitrypsin-expressing cells. Scale bars, 10 µm. B) Integral membrane protein CNX-mCherry decorates membranes of Z-α1-antitrypsin-containing inclusions. Scale bars, 5 µm. C) Lack of colocalization of atlastin and YFP-tagged α1-antitrypsin: cells were cotransfected with either YFP-M-α1-antitrypsin or YFP-Z-α1-antitrypsin (yellow) and hemagglutinin (HA)-tagged atlastin, then stained with anti-HA antibody (red). Scale bars, 10 µm. D) Lack of colocalization of atlastin-GFP- and YFP-tagged α1-antitrypsin: coexpression of GFP-tagged wild-type and K80A mutant atlastin (green), YFP-Z-α1-antitrypsin (yellow), and mCherry-ER (red). Poor localization is evident between atlastin-GFP and Z-α1-antitrypsin. Scale bars, 10 µm. E) Coexpression of GFP-tagged wild-type and K80A mutant atlastin (green) with mCherry-ER (red). Evident is tubular, nonbranching nature of ER in cells expressing mutant atlastin. F) mCherry FRAP was performed in CHO cells coexpressing mCherry-ER, Z-α1-antitrypsin, and either wild-type or K80A mutant atlastin.
Figure 8.
Figure 8.
Transport between inclusions is dependent on cytosol, Sar1, and sec22B and is sensitive to NEM. A, B) mCherry FRAP was performed in CHO cells coexpressing mCherry-ER and either YFP-M-α1-antitrypsin (A) or YFP-Z-α1-antitrypsin (B). Cells were placed in ice-cold CTB (control) or were permeabilized with digitonin for 5 min to remove cytosol. Control cells were washed with culture medium (blue squares), while permeabilized cells were either washed with TB (red squares) or reconstituted with purified cytosol (green triangles), then subjected to mCherry FRAP. mCherry FRAP was dramatically reduced in Z-α1-antitrypsin-exprssing cells in absence of cytosol (B, no cytosol vs. cytosol added, P < 0.0001). C, D) Cells coexpressing mCherry-ER and either M-α1-antitrypsin (C) or Z-α1-antitrypsin (D) were permeabilized and depleted of cytosol subjected to mCherry FRAP either in TB (orange squares) or buffer supplemented with ATP/GTP regenerating system consisting of 1 mM ATP, 10 μM GTP, 10 mM phosphocreatine, and 50 μg/ml creatine kinase in CTB (red circles). E, F) Digitonin permeabilized cells coexpressing mCherry-ER and either M-α1-antitrypsin (E) or Z-α1-antitrypsin (F) were treated with cytosol prepared from cells treated with 20 mM NEM (red squares) or untreated cells (green circles). Cytosol from NEM-treated cells is significantly impaired in supporting mCherry mobility (F, P < 0.0001). G, H) CHO cells cotransfected with mCherry-ER and either M-α1-antitrypsin (G) or Z-α1-antitrypsin (H) and either empty vector, wild-type (WT) Sar1 or dominant negative Sar1-T39N were subjected to mCherry FRAP (empty vs. WT, P = ns; WT vs. Sar1-T39N, P < 0.0001). I, J) CHO cells cotransfected with mCherry-ER and either M-α1-antitrypsin (I) or Z-α1-antitrypsin (J) and either control siRNA or siRNA targeting Sec22B were subjected to mCherry FRAP (J, control vs. s22B siRNA, P < 0.0001). Inset: immunoblot demonstrates degree of depletion of sec22B. K) CHO cells were cotransfected with YFP-Z-α1-antitrypsin (red) and GFP-ERGIC-53 (green). Images were acquired using Quasar acquisition and linear unmixing to separate YFP and GFP channels. Cells treated with 10 µg/ml brefeldin A contained population of luminal YFP-Z-α1-antitrypsin-positive and membrane GFP-ERGIC-53-positive structures (arrows). Scale bars, 10 µm.

References

    1. Lomas D. A. (2006) The selective advantage of alpha1-antitrypsin deficiency. Am. J. Respir. Crit. Care Med. 173, 1072–1077 - PubMed
    1. Dickens J. A., Lomas D. A. (2011) Why has it been so difficult to prove the efficacy of alpha-1-antitrypsin replacement therapy? Insights from the study of disease pathogenesis. Drug Des. Devel. Ther. 5, 391–405 - PMC - PubMed
    1. Lomas D. A., Evans D. L., Finch J. T., Carrell R. W. (1992) The mechanism of Z alpha 1-antitrypsin accumulation in the liver. Nature 357, 605–607 - PubMed
    1. Eriksson S., Carlson J., Velez R. (1986) Risk of cirrhosis and primary liver cancer in alpha 1-antitrypsin deficiency. N. Engl. J. Med. 314, 736–739 - PubMed
    1. Eriksson S. (1964) Pulmonary emphysema and alpha1-antitrypsin deficiency. Acta Med. Scand. 175, 197–205 - PubMed

Publication types

Substances