. 2017 Jun;37(6):2294-2307.
doi: 10.1177/0271678X16665380. Epub 2016 Jan 1.

Glycogen serves as an energy source that maintains astrocyte cell proliferation in the neonatal telencephalon

Affiliations

Glycogen serves as an energy source that maintains astrocyte cell proliferation in the neonatal telencephalon

Hitoshi Gotoh et al. J Cereb Blood Flow Metab. 2017 Jun.

Abstract

Large amounts of energy are required when cells undergo cell proliferation and differentiation for mammalian neuronal development. Early neonatal mice face transient starvation and use stored energy for survival or to support development. Glycogen is a branched polysaccharide that is formed by glucose, and serves as an astrocytic energy store for rapid energy requirements. Although it is present in radial glial cells and astrocytes, the role of glycogen during development remains unclear. In the present study, we demonstrated that glycogen accumulated in glutamate aspartate transporter (GLAST)+ astrocytes in the subventricular zone and rostral migratory stream. Glycogen levels markedly decreased after birth due to the increase of glycogen phosphorylase, an essential enzyme for glycogen metabolism. In primary cultures and in vivo, the inhibition of glycogen phosphorylase decreased the proliferation of astrocytic cells. The number of cells in the G1 phase increased in combination with the up-regulation of cyclin-dependent kinase inhibitors or down-regulation of the phosphorylation of retinoblastoma protein (pRB), a determinant for cell cycle progression. These results suggest that glycogen accumulates in astrocytes located in specific areas during the prenatal stage and is used as an energy source to maintain normal development in the early postnatal stage.

Keywords: Astrocytes; cell proliferation; glia; glycogen; metabolism.


Figures

Figure 1.
Figure 1.
Localization of glycogen in the embryonic telencephalon. (a–c): Coronal sections were pretreated with dimedone and stained using periodic acid Schiff reagent. CX indicates the cerebral cortex and Str, the striatum. The bar indicates 100 µm. (d) In an E18.5 sagittal section, glycogen was observed along the rostral migratory stream (RMS). The bar indicates 100 µm. (e–g) The dorsal/ventral boundary region of a–c (subventricular zone, SVZ) was magnified. (h) The pretreatment of sections with amylase completely abolished the staining of PAS+ glycogen. The bar indicates 50 µm. (i) Sections at E18.5 were stained by glycogen (magenta) with βIII-tubulin (green). (j–k) Sections were stained by glycogen (k and n) with βIII-tubulin (j) or GLAST (m). The SVZ area corresponding to the dashed box in (i) is shown. Merged images are shown in (l) and (o), respectively. The GLAST+/Glyc+ cell in (o, arrow) was merged with Hoechst staining (blue) and shown in the inset. The bar indicates 50 µm.
Figure 2.
Figure 2.
Decreased glycogen content in the postnatal SVZ. (a–c) E18.5 brain sections were double-stained with glycogen (b, magenta) and GLAST (a, green). A merged image is shown in (c). The bar indicates 50 µm. (d) Dimedone-PAS staining of the E18.5 SVZ is shown in (d). (e–g) P1 brain sections were double-stained as described above. (h) Dimedone-PAS staining of the P1 SVZ area. (i) Biochemical quantification of glycogen content in the SVZ (black bars) or cortex (gray bars). Glycogen content was normalized to protein concentrations. Error bars show S.D. and * indicates p < 0.05.
Figure 3.
Figure 3.
Expression of PygB in the SVZ and its postnatal increase. (a) A RT-PCR analysis was performed using cDNA prepared from the E18.5 olfactory bulb (Ob), rostral migratory stream (RMS), and subventricular zone (SVZ). No reverse transcriptase controls were shown as –RT. (b) In situ hybridization of the PygB gene in an E18.5 sagittal section (purple, arrows). The dashed line shows the lateral ventricle. (c) The total activity of phosphorylase a (active form) + b (less active form) observed along the RMS (purple, arrowheads) at P1. (d) In the P1 brain, active glycogen phosphorylase was also detected along RMS (arrowheads). (e–h) Total phosphorylase activities and active phosphorylase were examined in E18.5 (e and f) or P1 (g and h). The bar indicates 50 µm. (i) A biochemical assay of glycogen phosphorylase activity at E18.5 or P1 SVZ. The activity of phosphorylase a + b was analyzed by adding AMP to the reaction solution. Phosphorylase activity was calculated as unit and normalized to mg protein. Error bars indicate S.D. and * indicates p < 0.05 (n = 3). (j) The ratio of phosphorylase a to phosphorylase a + b at E18.5 or P1 SVZ. NS represents no significant difference.
Figure 4.
Figure 4.
Inhibition of glycogen phosphorylase led to cell cycle arrest in primary SVZ astrocytes (a–f): Primary cultured SVZ astrocytes were transfected with control siRNA (a–c) or siRNA against PygB (d–f). Forty-eight hours after transfection, cells were pulse labeled with 5 μM EdU for 1 h. GFAP was stained (magenta) together with the detection of EdU. Merged images with Hoechst nuclear staining were shown in (c) and (f). The bar indicates 50 µm. (g) Quantification of EdU+/GFAP+ cells divided by GFAP+ cells. The error bar shows S.D. and **indicates p < 0.01 (n = 4). (h) The cell cycle of siRNA-transfected primary astrocytes was analyzed by imaging cytometry. The white boxes show cells in the G1 phase, gray boxes show cells in the S phase, and light gray boxes show cells in the G2/M phase. (i–n) Adherent neural progenitor cells were transfected with siRNA as indicated and labeled with EdU (i and l) and Nestin (j and m). The bar indicates 50 µm. (o) Quantification of EdU+/Nestin+ cells divided by Nestin+ cells. The error bar shows S.D.
Figure 5.
Figure 5.
Inhibition of glycogen phosphorylase decreased cell proliferation in the postnatal SVZ. (a–d): PBS or DAB was injected into the lateral ventricle of P0 mice and brains were sampled 48 h later. Sections were stained with glycogen (magenta; a and c). Mitotic cells at P2 were visualized using a phospho-histone H3 antibody (pH3, magenta) and merged images with Hoechst (blue) were shown (b and d). The bar indicates 50 µm. (e): Quantitative analysis of pH3+ cells per section. The black bars show PBS-injected samples and gray bars show DAB-injected samples. The error bar shows S.D., *indicates p < 0.05, and NS represents no significant difference (n = 6). (f) PBS (black bar), CP-91149 (white bar), or DAB (gray bar) was injected into the lateral ventricle, and S-phase cells were labeled by injecting EdU one hour before sampling. EdU-positive cells in the SVZ were quantified (n = 6). (g–l): PBS or DAB-injected mice were labeled with EdU and stained with Ki67 (green; g and j) and EdU (magenta; h and k). Merged images were shown in i and l. The bar indicates 50 µm. (m) The percentage of EdU+ cells among Ki67+ cells in various brain areas. (n and o) The effects of a glycogen inhibitor treatment on cell proliferation at different times. DAB were injected into P1 (n) or P3 mice (o), and EdU+ cells were examined one day, two days, or five days after the injection. Error bars show S.D., * indicates p < 0.05 and ** indicates p < 0.01 (n = 6). (p and q) In situ hybridization of Glast mRNA (purple) in combination with BrdU immunohistochemistry (Brown). Arrows indicate Glast+/BrdU+ cells and the bar indicates 50 µm. (r) Quantification of BrdU+/Marker+ cells in the SVZ region. The number of cells was divided by 104 µm2 as the unit area (n = 4).
Figure 6.
Figure 6.
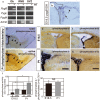
Inhibition of glycogen breakdown affected cell cycle inhibitors. (a) SVZ astrocytes were transfected with siRNA as indicated. The relative expression levels of p21 and p27 against beta-actin in control siRNA (black bars) or PygB siRNA (gray bars) transfected astrocytes are shown. Error bars show S.D., * indicates p < 0.05, and ** indicates p < 0.01 (n = 5). (b) A Western blot analysis of brain lysates injected with PBS or DAB. (c) The densities of bands were quantified using ImageJ and the ratio of phosphorylated pRB to total pRB was shown. The black bars show the ratio in PBS-treated brains and the gray bars show that in DAB-treated brains (n = 5).

References

    1. De Bock K, Georgiadou M, Schoors S, et al. Role of PFKFB3-driven glycolysis in vessel sprouting. Cell 2013; 154: 651–663. - PubMed
    1. Knobloch M, Braun SM, Zurkirchen L, et al. Metabolic control of adult neural stem cell activity by Fasn-dependent lipogenesis. Nature 2013; 493: 226–230. - PMC - PubMed
    1. Kuma A, Hatano M, Matsui M, et al. The role of autophagy during the early neonatal starvation period. Nature 2004; 432: 1032–1036. - PubMed
    1. Efeyan A, Zoncu R, Chang S, et al. Regulation of mTORC1 by the Rag GTPases is necessary for neonatal autophagy and survival. Nature 2013; 493: 679–683. - PMC - PubMed
    1. Magistretti PJ, Pellerin L. Cellular mechanisms of brain energy metabolism and their relevance to functional brain imaging. Philosoph Transac Royal Soc London Series B Biol Sci 1999; 354: 1155–1163. - PMC - PubMed

LinkOut - more resources