. 2016 Sep 20;113(38):10565-70.
doi: 10.1073/pnas.1603539113. Epub 2016 Sep 6.

Ultrafast anisotropic protein quake propagation after CO photodissociation in myoglobin

Affiliations

Ultrafast anisotropic protein quake propagation after CO photodissociation in myoglobin

Levin U L Brinkmann et al. Proc Natl Acad Sci U S A. .

Abstract

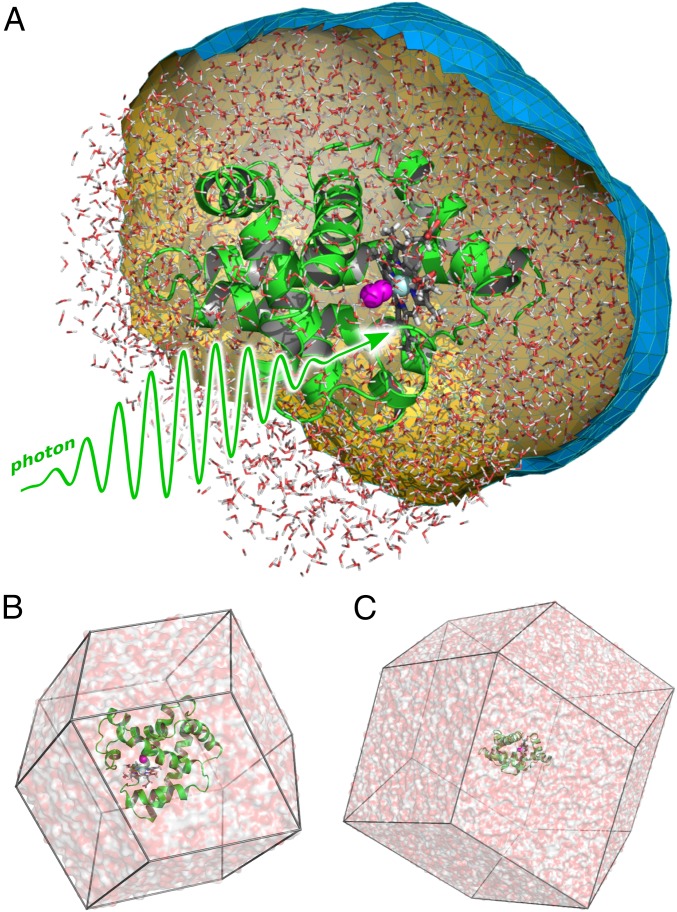
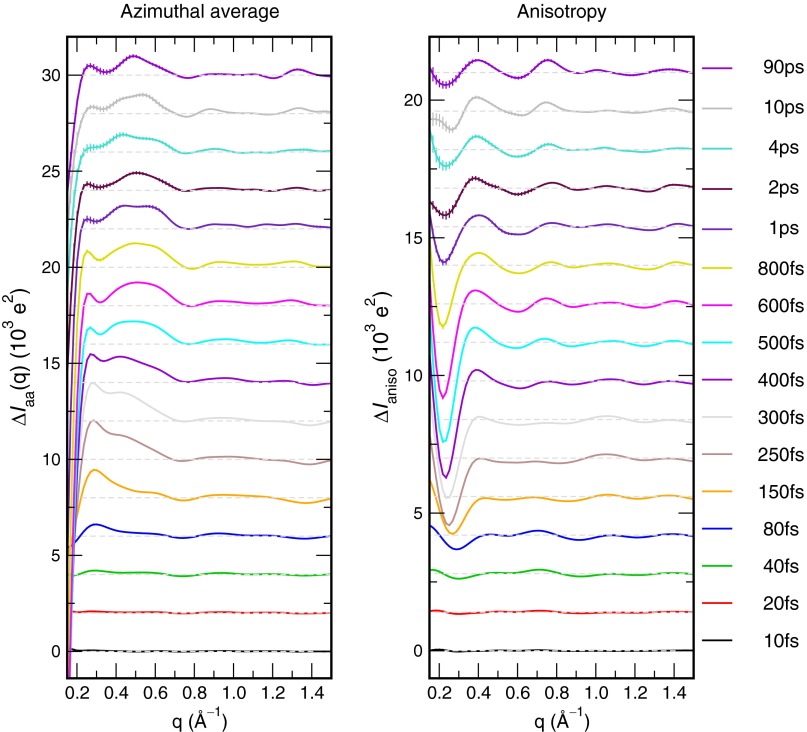
"Protein quake" denotes the dissipation of excess energy across a protein, in response to a local perturbation such as the breaking of a chemical bond or the absorption of a photon. Femtosecond time-resolved small- and wide-angle X-ray scattering (TR-SWAXS) is capable of tracking such ultrafast protein dynamics. However, because the structural interpretation of the experiments is complicated, a molecular picture of protein quakes has remained elusive. In addition, new questions arose from recent TR-SWAXS data that were interpreted as underdamped oscillations of an entire protein, thus challenging the long-standing concept of overdamped global protein dynamics. Based on molecular-dynamics simulations, we present a detailed molecular movie of the protein quake after carbon monoxide (CO) photodissociation in myoglobin. The simulations suggest that the protein quake is characterized by a single pressure peak that propagates anisotropically within 500 fs across the protein and further into the solvent. By computing TR-SWAXS patterns from the simulations, we could interpret features in the reciprocal-space SWAXS signals as specific real-space dynamics, such as CO displacement and pressure wave propagation. Remarkably, we found that the small-angle data primarily detect modulations of the solvent density but not oscillations of the bare protein, thereby reconciling recent TR-SWAXS experiments with the notion of overdamped global protein dynamics.

Keywords: free-electron laser; molecular dynamics; time-resolved SAXS/WAXS.


Conflict of interest statement

The authors declare no conflict of interest.

Figures

Fig. S1.
Fig. S1.
Cooling of the CO (Left) and cooling of the heme plane, taken as the porphryin atoms plus the iron (Right). The kinetic energy Ekin was translated to a temperature T via Ekin=fkBT/2, where kB denotes the Boltzmann constant and f denotes the number of degrees of freedom, taking constraints into account (f=5 for CO and f=36.5 for the heme plane). CO cooled within 300 fs due to collisions with protein atoms. The heme plane cooled rapidly within 1–2 ps, starting from 400 K, followed by slower relaxations beyond the 5-ps timescale shown here. These findings are compatible with previous reports (5, 10). The CO temperature curve implies that, in our simulations, 40% ( 55 kJ⋅mol−1) of the excess energy accumulated in kinetic energy of the CO, before the CO collided with protein atoms. This value appears reasonable in the light of recent quantum-chemical calculations, reporting the potential energy surface of the dissociating quintet state of the heme–CO complex (19), but the value appears somewhat too large in the light of early spectroscopic experiments (10). The temperatures in this figure were averaged over 8,500 dissociation simulations conducted with a TIP4P-Ew water model (see SI Materials and Methods for details).
Fig. 1.
Fig. 1.
(A) Molecular representation of myoglobin (Mb). The backbone trace is shown as green cartoon, the heme as gray sticks, CO as magenta spheres, and iron as light blue sphere. A spatial envelope, here at a distance of 6 Å from all protein atoms, is shown as blue/orange surface. Water atoms (white/red sticks) inside the envelope contribute to the SWAXS calculations. (B) Typical small and (C) large simulation system of Mb, used to compute WAXS and SAXS patterns, respectively.
Fig. 2.
Fig. 2.
(A) Time-resolved anisotropic WAXS patterns of Mb in units of e2. (B) Azimuthal average over the detector for time delays between 10 fs and 90 ps, and (C) anisotropy of the WAXS patterns, taken as the difference between the horizontal and vertical cuts in A. Curves at Δt>10 fs were offset for clarity. (D and E) Azimuthally averaged intensities at 0.28 and 0.75 Å−1 versus time delay (B, orange and green bars), computed from the whole system (blue), or by omitting the CO atoms (red). (F) Isosurfaces of the electron density difference maps at 20 fs, 150 fs, 400 fs, and 1.0 ps after photodissociation. Green and red surfaces indicate increased and reduced density, respectively. Opaque green and red surfaces: ±400 e⋅nm−3; transparent green and red surfaces: ±100 e⋅nm−3. Additional time delays are visualized in Movie S1. (G) Time-resolved center-of-mass displacement of a number of residues (top three panels) and α-helices (bottom panel), with respect to their position at Δt=0, as indicated in the legends. The density differences in F and curves in G illustrate the propagation of the protein quake.
Fig. S2.
Fig. S2.
Time-resolved anisotropic WAXS intensity patterns (in units of e2) computed from an average over 10,000 simulations. The time delay Δt is indicated in the subplots. y axis: direction of the excitation laser; x axis: direction of the excitation laser polarization.
Fig. S3.
Fig. S3.
Vertical cut (Left) and horizontal cut (Right) over anisotropic TR-WAXS patterns shown in Fig. 2A and Fig. S2. Curves at Δt>10 fs were offset for clarity.
Fig. S4.
Fig. S4.
Azimuthal average (Left) and anisotropy (Right) of the TR-WAXS patterns, computed from the coordinates of the protein (including heme) and solvent, but omitting the CO. In contrast to the TR-WAXS computed from the whole system (including CO), no minimum at q=0.75 Å−1 appears, suggesting that this minimum primarily reflects the displacement of the CO after photodissociation.
Fig. 3.
Fig. 3.
Analysis of the small-angle scattering data. (A) Mb (green cartoon) and explicit water (sticks) enclosed by envelopes with distance of 1, 7, 17, and 27 Å (blue surfaces). (B) Time-resolved change of the solvent density after CO photodissociation versus distance from the protein, demonstrating the propagation of a pressure wave across the hydration layer within 2 ps after CO photodissociation. Blue circles: Peak propagation expected from the speed of sound (1.48 nm/ps). (C) Time evolution of the radius of gyration after CO photodissociation ΔRgGuin(t) extracted from the Guinier analysis, thus taking hydration layer contributions into account. Color coding indicates calculations from different distance d of the envelope from the protein (see legend). (D) Volume of the protein taken from the forward intensity I(q=0). (E) Increase of radius of gyration of the bare protein ΔRgProt, ignoring any solvent effects.
Fig. S5.
Fig. S5.
Increase of the radius of gyration of the bare protein ΔRgProt, computed from the atomic coordinates of the protein atoms (including heme) after photodissociation. Black curve: averaged over 8,500 simulations of the small simulation system with TIP4P-Ew water; red curve: averaged over 10,000 simulations of the small system with TIP3P water, as used for all other explicit-solvent simulations. The figure demonstrates that ΔRgProt(Δt) hardly depends on the applied water model. ΔRgProt was scaled by ρp/(ρpρbulk) (ρbulk=334 e⋅nm−3, ρp=440 e⋅nm−3) to allow direct comparison with the radius of gyration computed from a Guinier analysis. See Materials and Methods for details.
Fig. S6.
Fig. S6.
COM displacements of a number of residues (Top) and α-helices (Bottom), with respect to their position at Δt=0, as indicated by the legends. Overdamped oscillations of Leu-29, Ile-30, His-93, and Ala-94 were observed with periods between 300 and 450 fs triggered by the dissociating CO and displaced iron. No indications for more global oscillations on a picosecond timescale are visible.
Fig. S7.
Fig. S7.
Mb with an increasingly thick hydration layer, as defined by the envelope (blue surface), at distances d of 1, 7, 17, and 27 Å from the protein atoms (see labels). Water molecules (red/white sticks) enclosed by the envelope were included in the calculations of SAXS/WAXS patterns.
Fig. S8.
Fig. S8.
Increase of the radius of gyration of the bare protein ΔRgProt upon CO photodissociation for Mb in vacuum. In vacuum, Mb exhibits underdamped oscillations because the pressure wave (or protein quake) cannot dissipate into the solvent but is instead reflected at the water/vacuum interface. The increase in ΔRgProt is smaller in vacuum, presumably because the vacuum conditions favor overcompacted Mb conformations compared with solution conditions. Each ΔRgProt curve shown here represents an average over 8,500 simulations. ΔRgProt was scaled by ρp/(ρpρbulk) (ρbulk=334 e⋅nm−3, ρp=440 e⋅nm−3) to allow direct comparison with the radius of gyration computed from a Guinier analysis. See Materials and Methods for details.
Fig. S9.
Fig. S9.
Increase of the radius of gyration of the bare protein ΔRgProt, computed from the atomic coordinates of the protein atoms (including heme) after photodissociation, and averaged over 10,000 simulations of the small simulation system. Absorption of additional photons was simulated as described in Materials and Methods. ΔRgProt was scaled by ρp/(ρpρbulk) (ρbulk=334 e⋅nm−3, ρp=440 e⋅nm−3) to allow direct comparison with the radius of gyration computed from a Guinier analysis. See Materials and Methods for details. Including the CO atoms yields ΔRgProt curves that are nearly identical to the curves shown here, suggesting that CO hardly contributes to ΔRgProt. The zero photon curve (blue) fluctuates within the statistical uncertainty up to 5 ps. For times larger than 5 ps, small systematic patterns appear, presumably due the onset of temperature and pressure coupling at 5 ps (SI Materials and Methods).

References

    1. Kendrew JC, et al. A three-dimensional model of the myoglobin molecule obtained by x-ray analysis. Nature. 1958;181(4610):662–666. - PubMed
    1. Wittenberg BA, Wittenberg JB. Transport of oxygen in muscle. Annu Rev Physiol. 1989;51(1):857–878. - PubMed
    1. Flögel U, Merx MW, Gödecke A, Decking UK, Schrader J. Myoglobin: A scavenger of bioactive NO. Proc Natl Acad Sci USA. 2001;98(2):735–740. - PMC - PubMed
    1. Petrich JW, Poyart C, Martin JL. Photophysics and reactivity of heme proteins: A femtosecond absorption study of hemoglobin, myoglobin, and protoheme. Biochemistry. 1988;27(11):4049–4060. - PubMed
    1. Mizutani Y, Kitagawa T. Direct observation of cooling of heme upon photodissociation of carbonmonoxy myoglobin. Science. 1997;278(5337):443–446. - PubMed

Publication types