. 2016 Sep 20;113(38):E5665-74.
doi: 10.1073/pnas.1604263113. Epub 2016 Sep 6.

Infiltrating monocytes promote brain inflammation and exacerbate neuronal damage after status epilepticus

Affiliations

Infiltrating monocytes promote brain inflammation and exacerbate neuronal damage after status epilepticus

Nicholas H Varvel et al. Proc Natl Acad Sci U S A. .

Abstract

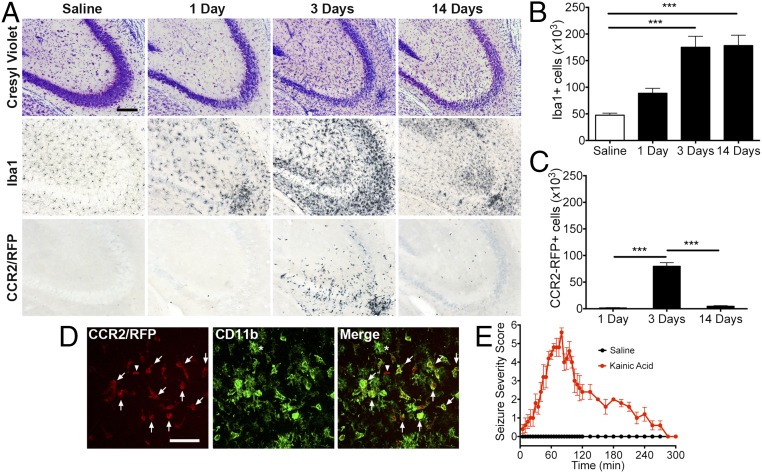
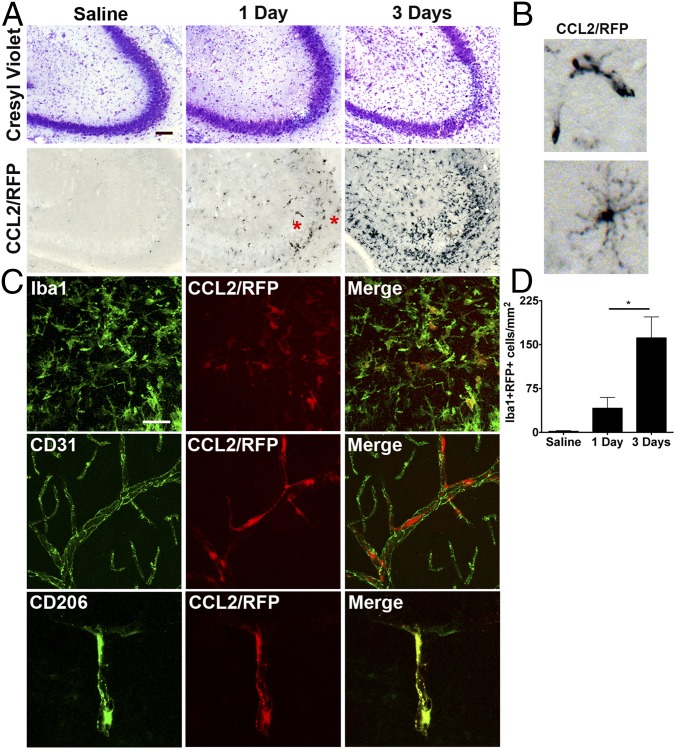
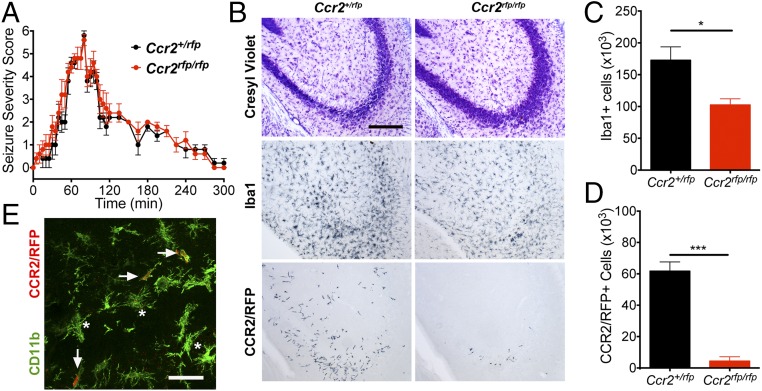
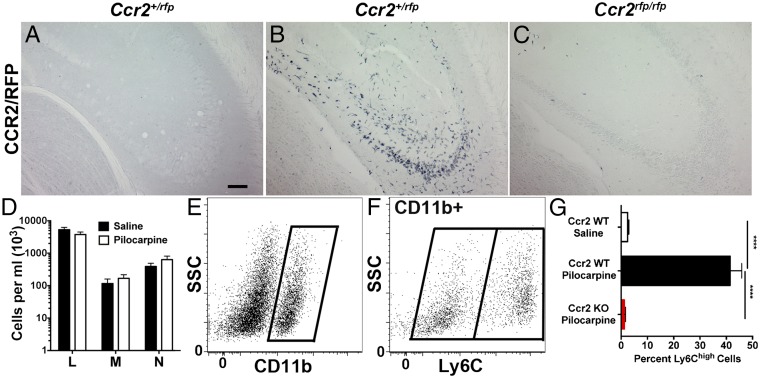
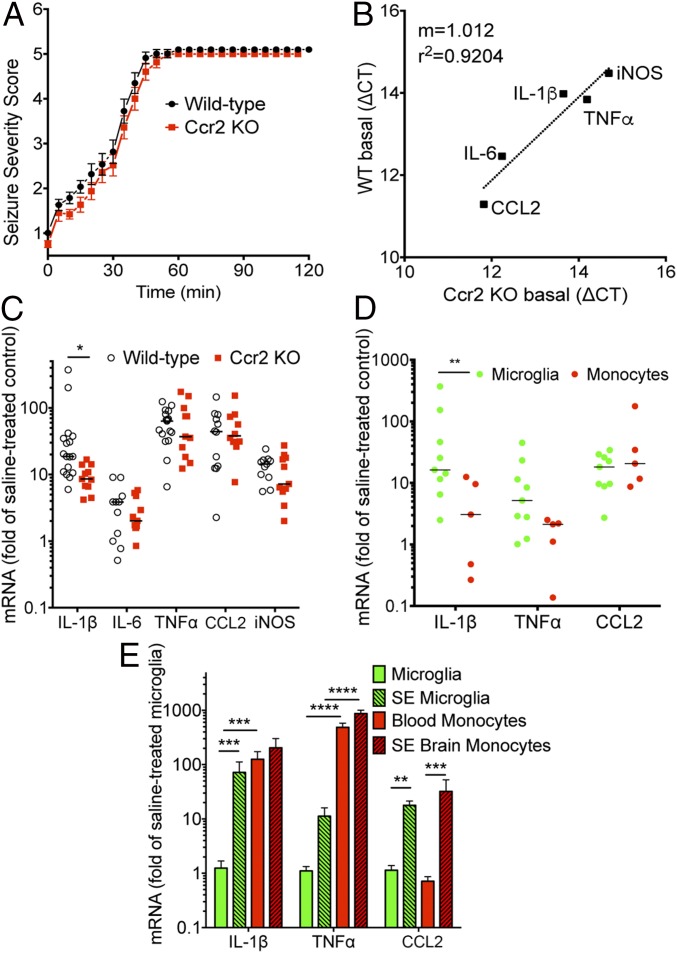
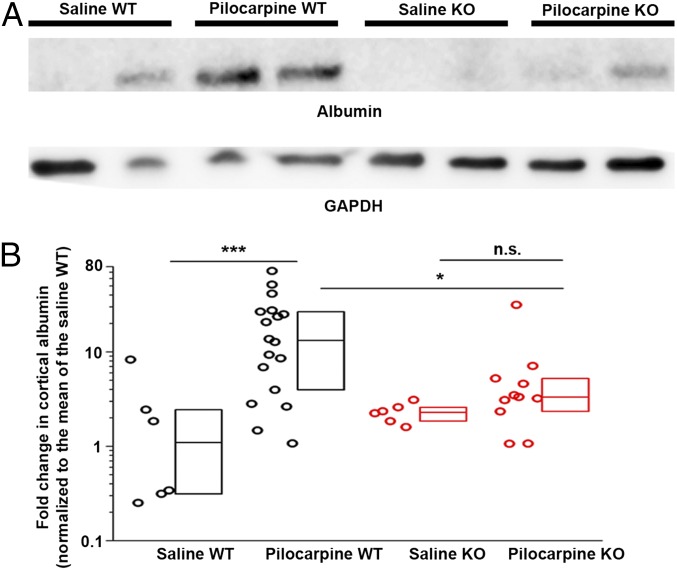
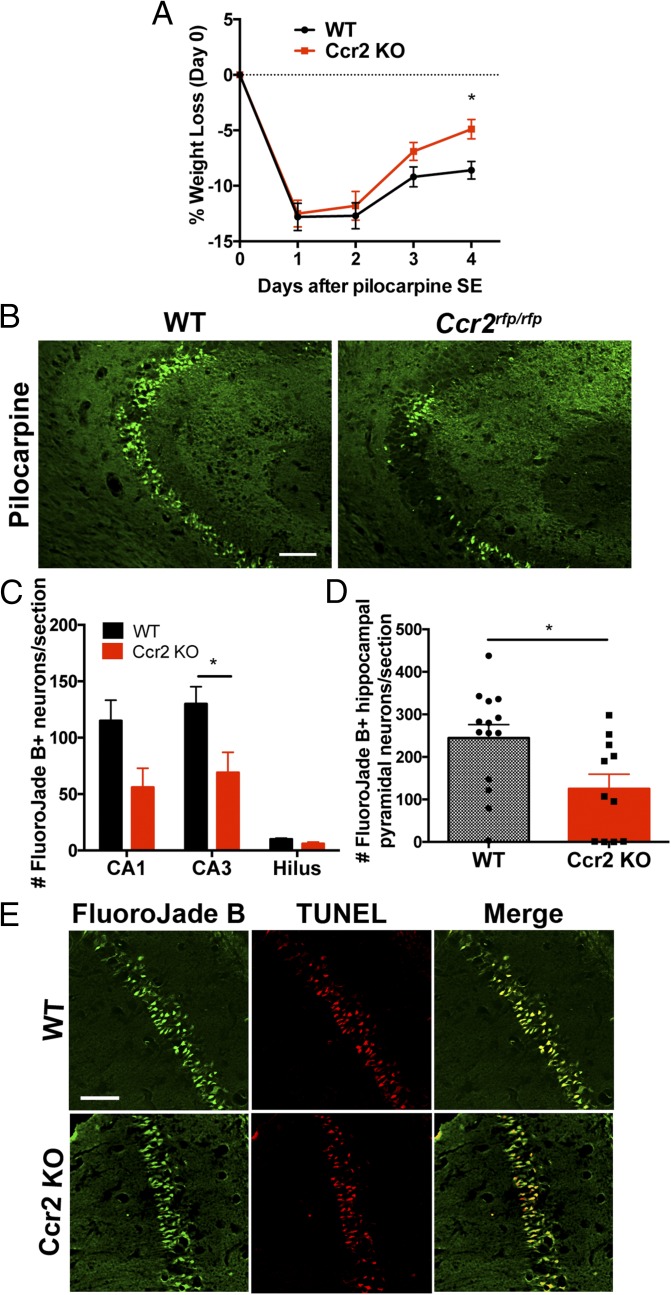
The generalized seizures of status epilepticus (SE) trigger a series of molecular and cellular events that produce cognitive deficits and can culminate in the development of epilepsy. Known early events include opening of the blood-brain barrier (BBB) and astrocytosis accompanied by activation of brain microglia. Whereas circulating monocytes do not infiltrate the healthy CNS, monocytes can enter the brain in response to injury and contribute to the immune response. We examined the cellular components of innate immune inflammation in the days following SE by discriminating microglia vs. brain-infiltrating monocytes. Chemokine receptor 2 (CCR2(+)) monocytes invade the hippocampus between 1 and 3 d after SE. In contrast, only an occasional CD3(+) T lymphocyte was encountered 3 d after SE. The initial cellular sources of the chemokine CCL2, a ligand for CCR2, included perivascular macrophages and microglia. The induction of the proinflammatory cytokine IL-1β was greater in FACS-isolated microglia than in brain-invading monocytes. However, Ccr2 knockout mice displayed greatly reduced monocyte recruitment into brain and reduced levels of the proinflammatory cytokine IL-1β in hippocampus after SE, which was explained by higher expression of the cytokine in circulating and brain monocytes in wild-type mice. Importantly, preventing monocyte recruitment accelerated weight regain, reduced BBB degradation, and attenuated neuronal damage. Our findings identify brain-infiltrating monocytes as a myeloid-cell subclass that contributes to neuroinflammation and morbidity after SE. Inhibiting brain invasion of CCR2(+) monocytes could represent a viable method for alleviating the deleterious consequences of SE.

Keywords: epileptogenesis; microgliosis; myeloid cell heterogeneity; neuroprotection; seizure.


Conflict of interest statement

The authors declare no conflict of interest.

Figures

Fig. 1.
Fig. 1.
Hippocampal cell loss and microgliosis precede infiltration of CCR2+ monocytes. Two-month-old CCR2-RFP male mice received intraperitoneal KA (30 mg/kg) or saline solution control injection and were killed 1, 3, or 14 d later. (A) The mice subject to KA showed neuronal cell loss in the CA3 hippocampal region at all time points examined. This was accompanied by microgliosis, which was robust at the 3-d time point. Anti-RFP immunohistochemistry revealed isolated CCR2-RFP+ cells at the 1- and 14-d time points. The 3-d time point showed massive infiltration of CCR2-RFP+ monocytes. Few CCR2-RFP+ cells were encountered in the saline solution-treated animals. (Scale bar: 100 μm.) (B) Stereological analysis of total hippocampal Iba1+ cells showed more than threefold increase at the 3- and 14-d time points. There was an approximately twofold increase 1 d after KA injection (n = 5 for each condition; one-way ANOVA followed by Dunnett’s post hoc tests). (C) Stereological analysis revealed ∼80,000 monocytes at the 3-d time point in the hippocampus. ANOVA followed by Tukey's post hoc tests revealed a significant difference of total hippocampal CCR2-RFP+ monocytes between 1 d and 3 d as well as 3 d and 14 d (***P < 0.001; n = 5). (D) Most CCR2-RFP–expressing cells (red) were also CD11b+ (green; arrows). A CCR2-RFP+;CD11b cell was occasionally encountered (arrowhead). Ramified CCR2-RFP CD11b+ microglia were also observed (asterisk). (Scale bar: 50 μm.) (E) All mice treated with KA showed a seizure severity score of at least 5.
Fig. 2.
Fig. 2.
Parenchymal Iba1+ myeloid cells and perivascular macrophages express CCL2 at 1 and 3 d after kainate administration. CCL2::mRFP mice received KA (30 mg/kg, i.p.) or saline solution control injection and were killed 1 or 3 d later. (A) The mice subject to KA showed neuronal cell loss in the CA3 hippocampal region at the time points examined. Anti-RFP immunohistochemistry revealed CCL2-RFP+ cells at the 1- and 3-d time points. At the 3-d time point, many CCL2-RFP+ microglia are observed in the hippocampus. (Scale bar: 100 μm.) (B) Higher-magnification (∼8× panels in Fig. 2A) images taken from cells at the 1-d time point revealing structures resembling blood vessels (right asterisk, A) and ramified microglia (left asterisk, A). (C) Representative images at 1 d showing Iba1 (microglia; Top), CD31 (endothelial cells; Middle), and CD206 (perivascular macrophages) staining with CCL2-RFP signal. Microglia and perivascular macrophages express CCL2. (Scale bar: 25 μm.) (D) Quantitative analysis of total hippocampal CCL2::RFP+ myeloid cells (Iba1+) in the hippocampus revealed a significant increase in the number of double-positive cells between the 1-d and 3-d time points (saline solution-treated, n = 2; 1-d, n = 3; 3-d, n = 3; *P = 0.047, unpaired t test). The bars indicate the mean ± SEM.
Fig. 3.
Fig. 3.
Ccr2 knockout mice have reduced numbers of Iba1+ cells and CCR2-RFP+ monocytes after SE. Two-month-old Ccr2+/rfp (n = 5) and Ccr2rfp/rfp (n = 4) mice received KA (30 mg/kg) and were monitored for seizure severity for 5 h. The mice were killed 3 d later. (A) The seizure severity was similar in the Ccr2 knockout mice compared with Ccr2 heterozygous animals after KA-induced SE. (B) At 3 d after SE, histological examination revealed that both genotypes showed neuronal damage in the CA3 region of the hippocampus as visualized by Cresyl violet staining, although damage appeared less pronounced in the Ccr2rfp/rfp mice. Analysis of adjacent sections showed that degeneration was accompanied by activation of Iba1+ microglia in Ccr2+/rfp and Ccr2rfp/rfp mice. However, robust infiltration of CCR2-RFP–expressing monocytes was observed in only the Ccr2+/rfp mice. (Scale bar: 100 μm.) (C) Stereological analysis of total hippocampal Iba1+ cells revealed a ∼36% reduction in number of Iba1+ cells in Ccr2rfp/rfp mice compared with Ccr2+/rfp. (D) Stereological counts of CCR2-RFP–expressing monocytes showed a robust reduction in numbers of monocytes 3 d after SE in the Ccr2rfp/rfp mice compared with Ccr2+/rfp mice subject to SE. The bars indicate the mean ± SEM (*P = 0.025 and ***P < 0.001, unpaired t tests). (E) The occasional small CCR2-RFP–expressing cell in the Ccr2rfp/rfp mice was CD11b+ (green; arrows) and is therefore likely to be a monocyte that has been called into the brain by a signal not requiring CCR2. The asterisks identify CCR2-RFP, CD11b+ cells. (Scale bar: 50 μM.)
Fig. 4.
Fig. 4.
Monocyte infiltration is robustly reduced in Ccr2 knockout mice after pilocarpine-induced SE, and SE does not change blood levels of circulating leukocytes. Two-month-old Ccr2+/rfp and Ccr2rfp/rfp mice were pretreated with methylscopolamine (2 mg/kg, i.p.) and terbutaline (2 mg/kg, i.p.), and injected 20 min later with pilocarpine hydrochloride (280 mg/kg, i.p.) to induce SE or saline solution. SE was allowed to persist for 1 h before being interrupted by diazepam (10 mg/kg, i.p.). Three days after SE, histological examination of hippocampal tissue revealed brain infiltration of CCR2-RFP+ monocytes in Ccr2+/rfp subject to pilocarpine (B), but not in Ccr2+/rfp animals that received saline solution (A) or in Ccr2rfp/rfp KO animals (C). (Scale bar: 50 μm.) (D) Blood values of lymphocytes (marked as “L”), monocytes (“M”), and neutrophils (“N”) were not altered between saline solution-treated control and pilocarpine-treated mice (n = 6 per treatment). (E and F) Isolated brain myeloid cells from CCR2-sufficient mice were gated on CD11b (E) and divided into Ly6Clow and Ly6Chigh populations (F). (G) Ly6C expression was quantified on the CD11b+ population in mice 4 d after SE. One-way ANOVA followed by Tukey’s post hoc test revealed significant differences between saline solution-treated Ccr2+/+ and pilocarpine-treated Ccr2+/+ mice as well as pilocarpine-treated Ccr2+/+ and Ccr2 KO animals (****P < 0.0001; n = 5 per group). The bars indicate the mean ± SEM.
Fig. 5.
Fig. 5.
Cytokine expression in hippocampus and myeloid cells after SE. (A) After pilocarpine injection, the behavioral seizure score was tabulated every 5 min until the seizure was interrupted by diazepam 1 h after SE onset in wild-type (n = 14) and Ccr2 knockout (n = 11). (B) The basal hippocampal levels of mRNA encoding inflammatory cytokines and mediators were similar in wild-type (n = 6) and Ccr2rfp/rfp (n = 6) animals injected with saline solution. (C) Median fold induction of the inflammatory cytokines and mediators in hippocampus is represented by the horizontal line and is plotted for wild-type (n ≥ 11) and Ccr2 knockout (n ≥ 10) mice 4 d after SE. Each symbol represents an individual mouse, with induction referenced to the mean of the appropriate saline solution-treated group. (D) Mice were subject to pilocarpine-induced SE for 1 h and killed 4 d later. mRNA was isolated from flow sorted CD11b+Ly6Clow microglia (n = 9) and CD11b+Ly6Chigh brain-infiltrating monocytes (n = 5) and measured by qRT-PCR. The mRNA changes for SE-activated microglia were normalized to the mean of brain-resident microglia (n = 5) from saline solution-treated animals, whereas brain-infiltrating monocytes after SE were normalized to blood monocytes (n = 5). The horizontal line represents the median fold induction of each inflammatory mediator. Each symbol represents a population of myeloid cells prepared from an individual mouse. (E) mRNA changes for the myeloid cells were normalized to the mean of saline solution-treated microglia. Bars indicate the mean ± SEM (*P = 0.028, **P < 0.01, ***P < 0.001, and ****P < 0.0001 by one-way ANOVA with Sidák multiple-comparisons test).
Fig. 6.
Fig. 6.
The integrity of the BBB is maintained in Ccr2 knockout mice after SE. (A) Serum albumin extravasation into the brain 4 d after pilocarpine SE was used to evaluate damage to the BBB. Albumin protein levels in cortical homogenates of saline-treated control wild-type (n = 6) and Ccr2-deficient (n = 6) mice and pilocarpine-treated wild-type (n = 18) and Ccr2-deficient (n = 11) mice were measured by Western blot with GAPDH as loading control. Two representative samples from each group are shown. (B) Normalized band intensity of the albumin protein relative to that of GAPDH and referenced to the mean albumin/GAPDH ratio in wild-type mice. The average log ratio of albumin was compared between each experimental group by one-way ANOVA with post hoc Sidák test with selected pairs (*P = 0.043 and ***P < 0.001). The fold-change normalized to the mean fold-change of the saline solution-treated wild-type group is plotted. Boxes represent the 25th/75th percentiles. The horizontal line in the boxes represents the median value.
Fig. 7.
Fig. 7.
Accelerated weight gain and neuroprotection in Ccr2 KO after SE. (A) Effect of CCR2 deficiency on mouse body weight change after pilocarpine SE (n = 11–14 mice per time point, two-way ANOVA, interaction P = 0.274, time P < 0.0001, genotype P = 0.02, day 4 Bonferroni post hoc test; *P = 0.036). (B) Fluoro-Jade B staining in hippocampal tissue sections 4 d after SE shows more injured neurons in the CA3 subfield of wild-type mice compared with Ccr2 knockout littermates. (Scale bar: 100 μm.) (C) A plot of the number of Fluoro-Jade B+ cells in hippocampal cell layers. The bars indicate the mean ± SEM of each group (*P = 0.016, unpaired t tests followed by Holm–Sidák test for multiple comparisons). (D) The number of Fluoro-Jade B+ pyramidal neurons per hippocampal section is plotted for wild-type (n = 14) and Ccr2 knockout (n = 11; *P = 0.018, unpaired t test). Each symbol represents the average number of Fluoro-Jade B+ pyramidal neurons per section in each mouse. (E) Four days after SE, Fluoro-Jade B staining and TUNEL labeling are colocalized in CA1 pyramidal neurons in wild-type and Ccr2 knockout mice. (Scale bar: 50 μm.)
Fig. S1.
Fig. S1.
Absence of Fluoro-Jade B staining and TUNEL+ hippocampal pyramidal neurons in saline solution-treated wild-type and Ccr2 knockout animals. (A) Fluoro-Jade B staining in hippocampal tissue sections from saline solution-treated mice shows no injured neurons in the CA3 subfield of the CCR2-sufficient and -deficient mice. (Scale bar: 100 μm.) (B) Fluoro-Jade B and TUNEL staining are absent in CA1 neurons in saline solution-treated CCR2-sufficient and -deficient mice. (Scale bar: 100 μm.)
Fig. S2.
Fig. S2.
Absence of cleaved caspase-3 immunoreactivity in hippocampal pyramidal neurons after pilocarpine. As a positive control, damaged skeletal muscle shows cleaved caspase-3 staining 7 d after injury. In contrast, 4 d after pilocarpine-induced SE, no cleaved caspase-3 signal is detected in hippocampus. (Scale bar: 100 μm.)

References

    1. Varvel NH, Jiang J, Dingledine R. Candidate drug targets for prevention or modification of epilepsy. Annu Rev Pharmacol Toxicol. 2015;55:229–247. - PMC - PubMed
    1. van Vliet EA, et al. Blood-brain barrier leakage may lead to progression of temporal lobe epilepsy. Brain. 2007;130(pt 2):521–534. - PubMed
    1. Sakuma S, Halliday WC, Nomura R, Ochi A, Otsubo H. Increased population of oligodendroglia-like cells in pediatric intractable epilepsy. Neurosci Lett. 2014;566:188–193. - PubMed
    1. Juhász C, et al. Successful surgical treatment of an inflammatory lesion associated with new-onset refractory status epilepticus. Neurosurg Focus. 2013;34(6):E5. - PMC - PubMed
    1. Vezzani A, Dingledine R, Rossetti AO. Immunity and inflammation in status epilepticus and its sequelae: Possibilities for therapeutic application. Expert Rev Neurother. 2015;15(9):1081–1092. - PMC - PubMed

Publication types

MeSH terms

LinkOut - more resources