. 2016 Sep 20;113(38):E5685-93.
doi: 10.1073/pnas.1611424113. Epub 2016 Sep 6.

SCAP/SREBP pathway is required for the full steroidogenic response to cyclic AMP

Affiliations

SCAP/SREBP pathway is required for the full steroidogenic response to cyclic AMP

Masami Shimizu-Albergine et al. Proc Natl Acad Sci U S A. .

Abstract

Luteinizing hormone (LH) stimulates steroidogenesis largely through a surge in cyclic AMP (cAMP). Steroidogenic rates are also critically dependent on the availability of cholesterol at mitochondrial sites of synthesis. This cholesterol is provided by cellular uptake of lipoproteins, mobilization of intracellular lipid, and de novo synthesis. Whether and how these pathways are coordinated by cAMP are poorly understood. Recent phosphoproteomic analyses of cAMP-dependent phosphorylation sites in MA10 Leydig cells suggested that cAMP regulates multiple steps in these processes, including activation of the SCAP/SREBP pathway. SCAP [sterol-regulatory element-binding protein (SREBP) cleavage-activating protein] acts as a cholesterol sensor responsible for regulating intracellular cholesterol balance. Its role in cAMP-mediated control of steroidogenesis has not been explored. We used two CRISPR (clustered regularly interspaced short palindromic repeat)-Cas9 (CRISPR associated protein 9) knockout approaches to test the role of SCAP in steroidogenesis. Our results demonstrate that SCAP is required for progesterone production induced by concurrent inhibition of the cAMP phosphodiesterases PDE4 and PDE8. These inhibitors increased SCAP phosphorylation, SREBP2 activation, and subsequent expression of cholesterol biosynthetic genes, whereas SCAP deficiency largely prevented these effects. Reexpression of SCAP in SCAP-deficient cells restored SREBP2 protein expression and partially restored steroidogenic responses, confirming the requirement of SCAP-SREBP2 in steroidogenesis. Inhibitors of 3-hydroxy-3-methylglutaryl-Coenzyme A reductase and isoprenylation attenuated, whereas exogenously provided cholesterol augmented, PDE inhibitor-induced steroidogenesis, suggesting that the cholesterol substrate needed for steroidogenesis is provided by both de novo synthesis and isoprenylation-dependent mechanisms. Overall, these results demonstrate a novel role for LH/cAMP in SCAP/SREBP activation and subsequent regulation of steroidogenesis.

Keywords: SCAP/SREBP; cAMP; cholesterol; phosphodiesterase; steroidogenesis.


Conflict of interest statement

The authors declare no conflict of interest.

Figures

Fig. 1.
Fig. 1.
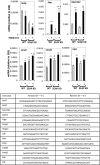
SCAP deficiency generated by the CRISPR-Cas9 system elicited reductions in SREBP2, steroidogenesis, and cholesterol biosynthetic genes. (A) MA10 cell extracts collected from a SCAP knockdown (KD) cell pool and a WT cell pool were used to determine SCAP and SREBP2 protein levels. For determination of p-HSL (Ser660 rat, Ser651 mouse) and StAR, both cell groups were treated with vehicle or PDE4+8 inhibitors (PDE4+8 in; 10 µM rolipram and 200 nM PF-04957325) for 15 min (p-HSL) or 2 h (StAR) before harvest. (B) A SCAP KD cell pool (red bars) and WT cell pool (blue bars) were serum-starved for 3 h and then treated with either vehicle, PDE inhibitors, LH (20 ng/mL), or LH plus PDE inhibitors for an additional 2 h. Progesterone released into the medium was quantified by ELISA. Each value represents mean ± SD (n = 4). Representative results from four repeated experiments are shown. (C) Messenger RNA levels were determined by quantitative real-time PCR using total RNA collected from SCAP KD cell pools and WT cell pools. Both groups were treated with vehicle or PDE inhibitors for 18 h under serum-starved conditions. Each value represents mean ± SD (n = 4). Data represent one of two sets of analyses. Statistical significance is shown as *P < 0.05 and **P < 0.01 vs. (-) inhibitors; P < 0.01 vs. WT.
Fig. S1.
Fig. S1.
Effect of SCAP deficiency on mRNA levels of proteins likely to be involved in steroidogenesis. Messenger RNA levels were determined by quantitative real-time PCR using total RNA collected from the SCAP KD pool and the WT cell pool. Both groups were treated with vehicle or PDE4+8 inhibitors (10 µM rolipram and 200 nM PF-04957325) for 18 h under serum-starved conditions. Each value represents mean ± SD (n = 4). Data represent one of two sets of analyses. Statistical significance is shown as *P < 0.05 and **P < 0.01 vs. (-) inhibitors; P < 0.01 vs. WT. (Lower) Sequences of each primer set used for quantitative real-time PCR are shown.
Fig. 2.
Fig. 2.
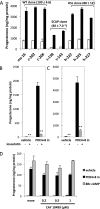
Steroidogenesis and cholesterol/isoprenoid biosynthetic pathway in SCAP-deficient cell clones generated by the CRISPR-FokI/dCas9 system. (A and B) SCAP-deficient clonal cells (s-138, s-139, s-140, s-141, s-142, and s-143) (A), HSL-deficient clonal cells (h-222, h-225, and h-227) (B), and WT clonal cells (ms-16, c-202, c-203, and c-206) were serum-starved for 3 h and treated with vehicle (Lower) or PDE4+8 inhibitors (10 µM rolipram and 200 nM PF-04957325; Upper) for 2 h under serum-starved conditions. Each value represents mean ± SD (n = 4). The numbers are represented relative to WT, mean ± SD (n = 3–6). *P < 0.05 and **P < 0.01 vs. WT. (C) SCAP and HSL levels were determined by Western blot analysis using whole-cell extracts of each clonal cell line. GAPDH was used as a loading control. (D) Whole-cell extracts and mitochondrial fractions were isolated from ms-16 and s-143 cells. Free cholesterol was measured in each fraction. Results are presented as relative to ms-16 (WT). Each value represents mean ± SD (n = 3) obtained from three repeated experiments. Free cholesterol levels were 11.4 ± 1.1 (n = 4) and 120.0 ± 8.5 (n = 4; pmol/µg protein) in whole-cell extract and mitochondrial fraction, respectively. *P < 0.05 and **P < 0.01 denote statistical significance. (E) ms-16 cells were pretreated with methyl-β-cyclodextrin cholesterol (Chol; 1 mM) or mouse HDL (25 µg/mL) with or without lovastatin (0.5 µM) for 30 min. Cells were then stimulated with PDE4+8 inhibitors for 2 h under serum-starved conditions. Each value represents the relative changes to PDE inhibitor-induced steroidogenesis without lovastatin as 100%; mean ± SD (n = 3). Progesterone levels in cells exposed to PDE inhibitors but not to exogenous cholesterol (indicated as “none” in the figure) were 791 ± 60 (n = 3; ng/mg protein). **P < 0.01 vs. none; P < 0.01 vs. (-) lovastatin. (F) ms-16 cells were pretreated with the indicated concentrations of lovastatin for 30 min and then treated with vehicle or PDE4+8 inhibitors for an additional 2 h under serum-starved conditions. Progesterone production in the absence of lovastatin is indicated by the black bar. The SCAP-deficient s-138 cell clone (red bar) was treated with PDE4+8 inhibitors in the absence of lovastatin. Each value represents mean ± SD (n = 4) of PDE inhibitor-stimulated progesterone levels after subtraction of basal levels. Representative results from three repeated experiments are shown. **P < 0.01 vs. cells in the absence of lovastatin (-). (G) ms-16 cells were pretreated with GGTI (2 and 5 µM) or FTI (2 and 5 µM) for 30 min and then treated with vehicle or PDE4+8 inhibitors for an additional 2 h under serum-starved conditions. Each value represents mean ± SD (n = 4) of PDE inhibitor-stimulated progesterone levels after subtraction of basal levels. Representative results from three repeated experiments are shown. **P < 0.01 vs. (-). (H) ms-16 cells were pretreated with mevalonate (10 mM) or GGPP (10, 30, and 50 µM) with or without lovastatin (0.5 µM) for 30 min. s-138 cells were pretreated with GGPP (10, 30, and 50 µM) for 30 min, and then both cell clones were stimulated with PDE4+8 inhibitors under serum-starved conditions. Each value represents the relative change to the level of PDE inhibitor-induced steroidogenesis in ms-16 cells; mean ± SD (n = 4). Representative results from three repeated experiments are shown. *P < 0.05 and **P < 0.01 denote statistical significance.
Fig. S2.
Fig. S2.
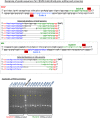
Guide sequences for CRISPR-FokI/dCas9 gene editing and screening. For editing the mouse SCAP and HSL genes, two guide RNA sequences (guide A, blue; guide B, green) were chosen using ZiFiT Targeter software (zifit.partners.org). Clonal cell lines were first screened by PCR/4% gel analysis. One representative gel image is shown (Bottom). We selected several positive clones showing multiple PCR amplicons (yellow asterisks). The efficiency for SCAP and HSL editing was 42 clones among 52 (80.8%) and 7 among 17 (41.2%), respectively. We then performed Western blot analysis of protein levels (for example, Fig. 2C). Clones with no protein expression were further analyzed by TA cloning and sequencing. The detected gene mutations were different-sized deletions occurring between the two guide sequences as shown (Top). PAM, protospacer adjacent motif.
Fig. S3.
Fig. S3.
Steroidogenesis under serum-fed conditions in SCAP-deficient cell clones generated by the CRISPR-FokI/dCas9 system. (A) SCAP clonal cells (s-138 and s-143), HSL clonal cells (h-222, h-225, and h-227), and WT clonal cells (ms-16, c-202, and c-206) were treated with vehicle (light columns) or PDE4+8 inhibitors (solid columns) for 2 h in the presence of serum. Progesterone released into the medium was quantified by ELISA. The results represent values relative to WT clones, mean ± SD. The experiment was repeated several times for different clones. The experiment shown was performed in triplicates. *P < 0.05 vs. WT. (B and C) The effects of lovastatin on steroidogenesis. MA10 cells were pretreated with or without lovastatin (0.5 µM) for 30 min. Cells were further treated with vehicle or PDE4+8 inhibitors for 16 h under serum-starved (B) or serum-fed conditions (C) in the presence or absence of lovastatin for measurement of steroidogenesis. Each value represents mean ± SD (n = 4). Representative results from three repeated experiments are shown. **P < 0.01 vs. (-) lovastatin. (D) MA10 cells pretreated with the HSL inhibitor CAY10499 for 30 min after 3 h of serum starvation. The cells were further treated with vehicle, PDE4+8 inhibitors, or 8Br-cAMP (500 µM) for 2 h for measurement of steroidogenesis. Each value represents mean ± SD (n = 4). Representative results from two repeated experiments are shown.
Fig. 3.
Fig. 3.
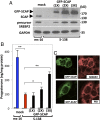
Restoration of SREBP2 and steroidogenesis by reexpression of SCAP in a SCAP-deficient cell clone. The cell clones s-138 and ms-16 were transfected with GFP-SCAP (2.5, 5, or 7.5 µg DNA in 2 × 10⁶ cells) or mock transfected together with a pIRS-GFP/Puro plasmid. Twenty-four hours later, puromycin was added to the medium and the cells were cultured for another 24 h. (A) Cell extracts were used to determine SCAP, GFP-SCAP, and SREBP2 by Western blot analysis. (B) The cells were treated with vehicle (unfilled column) or PDE4+8 inhibitors (filled column) for 2 h under serum-starved conditions for measurement of steroidogenesis. Each value represents mean ± SEM (n = 4). Representative results from three repeated experiments are shown. *P < 0.05 and **P < 0.01 denote statistical significance. (C) SCAP-deficient s-138 cells transfected with GFP-SCAP without the pIRS-GFP-Puro plasmid were immunostained with either an anti-SREBP2 antibody or an anti-PDI antibody (ER marker), as described in SI Materials and Methods.
Fig. 4.
Fig. 4.
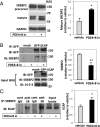
PDE4+8 inhibition increases SREBP2 activity. (A) MA10 cells were serum-starved for 3 h and then treated with vehicle or PDE4+8 inhibitors. Nuclear and cytosolic fractions were isolated and used to determine mature SREBP2 and precursor SREBP2, respectively, by using a rabbit anti-SREBP2 antibody detecting both full-length and cleaved SREBP2. The values in the bar graph represent mean ± SEM of densitometric data obtained from three separate experiments. (B) MA10 cells transfected with GFP-SCAP were treated with vehicle or PDE4+8 inhibitors for 2 h, and cell extracts were used for immunoprecipitation with an anti-GFP antibody. Immunoprecipitated samples and the lysate (6%) were used to determine SREBP2 levels (rabbit SREBP2 antibody) and expressed GFP-SCAP. 14-3-3 protein was used as a loading control. The values in the bar graph represent mean ± SEM of densitometric data obtained from three separate experiments. IB, immunoblotting; IP, immunoprecipitation. (C) MA10 cells were treated with vehicle or PDE4+8 inhibitors for 2 h, and cell extracts were then used for immunoprecipitation with a mouse anti-SREBP2 antibody (anti-SR) recognizing full-length SREBP2 and the C-terminal fragment of cleaved SREBP2, or control IgG (cont IgG). Immunoprecipitated samples and the lysate (6%) were used to determine SCAP levels. The values in the bar graph represent mean ± SEM of densitometric data obtained from two separate experiments each performed in triplicates. *P < 0.05 and **P < 0.01 denote statistical significance.
Fig. 5.
Fig. 5.
PDE4+8 inhibitors and PKA activators increase Ser821 phosphorylation of SCAP. (A) MA10 cells were serum-starved for 3 h and then treated with vehicle, PDE8 inhibitor (200 nM), PDE4 inhibitor (10 µM), or PDE4+8 inhibitors for the indicated incubation times. H89 (10 µM) or Rp-8-CPT-cAMPS (Rp; 0.5 mM) was added to the cells 30 min before addition of PDE4+8 inhibitors (20-min stimulation). The intensity of p-SCAP was densitometrically measured and is shown as an average (SD) (n = 3). Serum-starved MA10 cells were also treated with LH (20 ng/mL) or 8Br-cAMP (300 µM) for 10–40 min. The cell extracts were used to determine the phosphorylated SCAP at S821. Total SCAP or GAPDH was used as a loading control. (B) MA10 cells transfected with GFP-SCAP were used for immunostaining with the phospho-SCAP–specific antibody (Ser821). Phospho-SCAP immunoreactivity was labeled with an anti-rabbit secondary antibody conjugated with Alexa 546 (red). TOPRO3 was used as a nuclear counterstain (blue).
Fig. S4.
Fig. S4.
PDE4+8 inhibitors increase Ser821 phosphorylation of SCAP. (A) MA10 cells were serum-starved for 3 h and then treated with vehicle or a combination of PDE8 inhibitor (200 nM) and PDE4 inhibitor (10 µM) for the indicated incubation times. The cell extracts were used to determine SCAP S821 phosphorylation by Western blot. Note the single band detected by the antibody. (B) Antibody specificity was further confirmed in a SCAP-deficient cell clone. A WT cell clone (ms-16) and a SCAP-deficient cell clone (s-143) were serum-starved for 3 h and then treated with PDE8 and PDE4 inhibitors for 30 min. The cell extracts were used to determine phospho-S821 SCAP, total SCAP, or GAPDH. Note the absence of bands in the SCAP-deficient cell clone.
Fig. S5.
Fig. S5.
Active RhoA is increased by PDE4+8 inhibition in MA10 cells. Cells were serum-starved for 3 h and treated with vehicle or PDE4+8 inhibitors for 15 or 30 min. GTP-bound active RhoA was immunoprecipitated with rhotekin-RBD beads and analyzed by Western blot using an anti-RhoA antibody. A similar level of total RhoA in each sample is detected. (A) A representative blot from three repeated experiments is shown. (B) The intensity of each GTP-bound RhoA and total RhoA was measured by ImageJ (NIH). Values of GTP-bound RhoA relative to total RhoA represent mean ± SEM of three repeated experiments. *P < 0.05 and **P < 0.01 denote statistical significance vs. vehicle.

References

    1. Bender AT, Beavo JA. Cyclic nucleotide phosphodiesterases: Molecular regulation to clinical use. Pharmacol Rev. 2006;58(3):488–520. - PubMed
    1. Maurice DH, et al. Advances in targeting cyclic nucleotide phosphodiesterases. Nat Rev Drug Discov. 2014;13(4):290–314. - PMC - PubMed
    1. Tsai LC, Beavo JA. The roles of cyclic nucleotide phosphodiesterases (PDEs) in steroidogenesis. Curr Opin Pharmacol. 2011;11(6):670–675. - PMC - PubMed
    1. Tsai LC, Shimizu-Albergine M, Beavo JA. The high-affinity cAMP-specific phosphodiesterase 8B controls steroidogenesis in the mouse adrenal gland. Mol Pharmacol. 2011;79(4):639–648. - PMC - PubMed
    1. Shimizu-Albergine M, Tsai LC, Patrucco E, Beavo JA. cAMP-specific phosphodiesterases 8A and 8B, essential regulators of Leydig cell steroidogenesis. Mol Pharmacol. 2012;81(4):556–566. - PMC - PubMed

Publication types

MeSH terms

LinkOut - more resources