Review
. 2016 Aug 23:8:28.
doi: 10.3389/fnsyn.2016.00028. eCollection 2016.

Correlative Light Electron Microscopy: Connecting Synaptic Structure and Function

Affiliations
Review

Correlative Light Electron Microscopy: Connecting Synaptic Structure and Function

Isabell Begemann et al. Front Synaptic Neurosci. .

Abstract

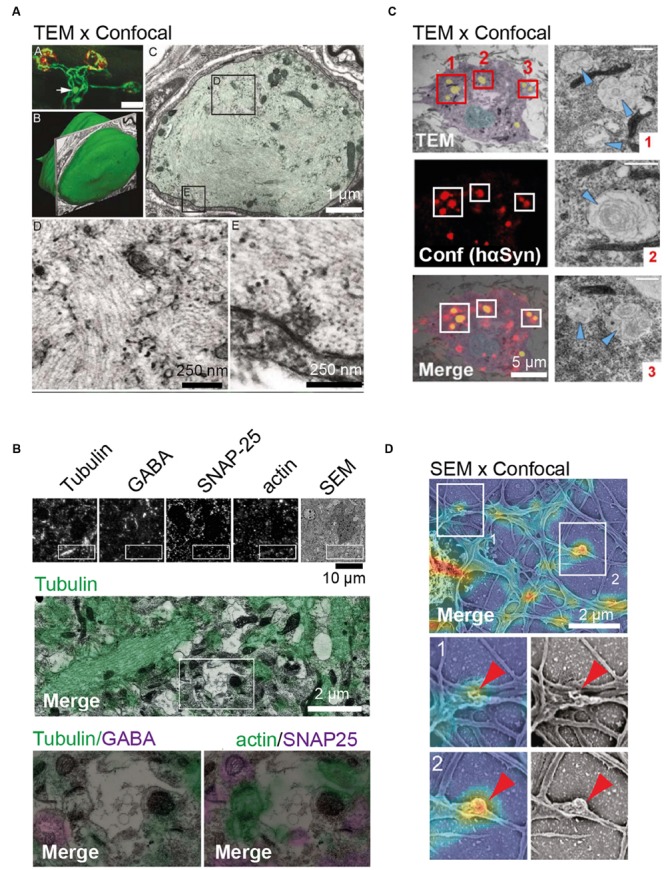
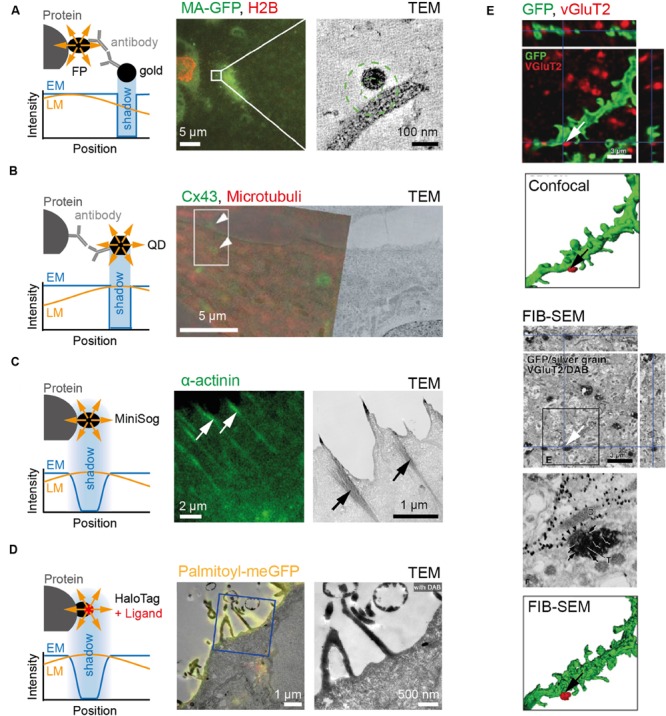
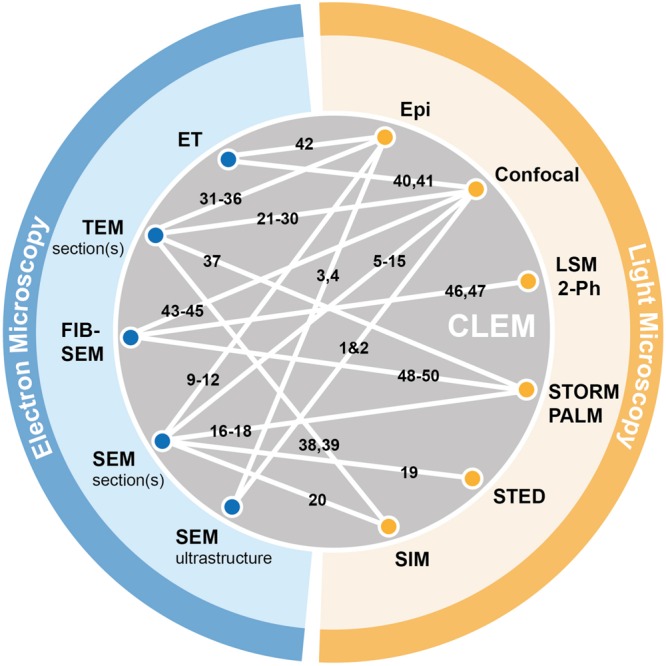
Many core paradigms of contemporary neuroscience are based on information obtained by electron or light microscopy. Intriguingly, these two imaging techniques are often viewed as complementary, yet separate entities. Recent technological advancements in microscopy techniques, labeling tools, and fixation or preparation procedures have fueled the development of a series of hybrid approaches that allow correlating functional fluorescence microscopy data and ultrastructural information from electron micrographs from a singular biological event. As correlative light electron microscopy (CLEM) approaches become increasingly accessible, long-standing neurobiological questions regarding structure-function relation are being revisited. In this review, we will survey what developments in electron and light microscopy have spurred the advent of correlative approaches, highlight the most relevant CLEM techniques that are currently available, and discuss its potential and limitations with respect to neuronal and synapse-specific applications.

Keywords: CLEM; SEM; TEM; correlative light electron microscopy; electron microscopy; fluorescence microscopy; neuron; synapse.


Figures

FIGURE 1
FIGURE 1
Examples of in situ and in vitro correlative light electron microscopy (CLEM) approaches. (A) In situ CLEM of confocal and transmission electron microscopy (TEM) images showing axonal retreat from neuromuscular junctions. Top left image shows confocal image depicting axonal bulb (arrow) present 25 um from the neuromuscular junction site (in red). Middle left image illustrating surface rendering of the bulb indicated above. Top right image shows TEM, shows that the bulb is sheathed by Schwann cells. TEM images at the bottom depict neurofilament disorganization in axonal bulb. (B) In situ CLEM of confocal and scanning electron microscopy (SEM) images of 70 nm section from the mouse cerebral cortex. From left to right: immunostaining of ultrathin sections for tubulin, GABA, SNAP-25, β-actin, and SEM image. Below, the boxed region is shown at a higher magnification. (C) In vitro CLEM of confocal and TEM images of hippocampal neurons. Ultrastructure of hα-Syn inclusions in cultured neurons from SNCA+/- mice shown in TEM (top), confocal image (middle), and as merged CLEM image (bottom). For illustration, the nucleus is rendered in blue, the cytosol in purple, and inclusions in yellow. To the right, high-resolution images of inclusions (red boxes 1–3), with arrowheads indicating filamentous structures, are shown. (D) In vitro CLEM of confocal and SEM images of cultured hippocampal neurons. Alignment of SEM and fluorescence signal for actin in cultured hippocampal neurons (top) and magnified sections of actin-rich convoluted nodes that form along dendritic arbors (bottom) are shown. Scale bars: (A) 25 μm at the top left, 1 μm at the top right, 0.25 μm at the bottom; (B) 10 μm at the top and 2 μm at the bottom; (C) 5 μm; (D) 2 μm. Pictures reprinted with permission from: (A) (Bishop et al., 2004); (B) (Micheva and Smith, 2007); (C) (Fares et al., 2016); (D) (Galic et al., 2014).
FIGURE 2
FIGURE 2
Examples of markers commonly used for CLEM. (A) To the left, cartoon depicting immune-gold labeling of genetically encoded fluorescent protein. Note difference between the relative position of signal in fluorescence (yellow) and electron microscope (blue) images caused by antibodies. To the right, an example showing fluorescence and electron micrographs of HIV particle labeled with MA-EGFP on MDCK cells expressing RFP-tagged Histone 2B. (B) To the left, cartoon depicting protein and signal from QD in fluorescence (yellow) and electron microscope (blue) images. Note difference between protein epitope recognized by antibody and QD signal position. To the right, example depicting RFL6 fibroblasts fixed and stained with primary antibodies followed by secondary antibodies linked to QDs. QDs identify Cx43 at gap junctions and trafficking intermediates (green) and α-tubulin in microtubules (red). (C) To the left, cartoon depicting genetically encoded MiniSOG, as well as the relative position and signal shape for fluorescence (yellow) and electron microscope (blue) images. To the right, an example showing fluorescence and electron micrographs of HeLa cells expressing miniSOG labeled α-actinin. (D) To the left, cartoon depicting HaloTag labeling of protein as well as position and signal shape for fluorescence (yellow) and electron microscope (blue) images. To the right, an example showing fluorescence and electron micrographs of Hela cell transfected with Palmitoyl-HaloTag-meGFP. (E) Dendrites of medium-size spiny neurons in the rat neostriatum labeled with membrane-targeted GFP and immunolabeled with Cy5 against vesicular glutamate transporter2 (VGluT2; top). After detection by fluorescence microscopy, GFP and VGluT2 immunoreactivities were further developed for focused ion-beam SEM (FIB-SEM) via immunogold/silver enhancement and immunoperoxidase/DAB methods, respectively (bottom). Scale bars: (A) 5 μm to the left and 100 nm to the right; (B) 5 μm; (C) 2 μm to the left and 1 μm to the right; (D) 1 μm to the left and 500 nm to the right; (E) 3 μm. Pictures reprinted with permission from: (A) (Kukulski et al., 2011); (B) (Giepmans et al., 2005); (C) (Shu et al., 2011); (D) (Liss et al., 2015); (E) (Sonomura et al., 2013).
FIGURE 3
FIGURE 3
Graphical summary of existing CLEM approaches. Electron microscopy (blue) and light-based techniques (yellow) that were successfully combined in correlative approaches are depicted by white lines connecting the respective methods. References corresponding to individual publications using specific CLEM approaches (numbered 1–50) can be found in the Supplementary Materials (Supplementary Table S1).

References

    1. Abbe (1883). The relation of aperture and power in the microscope. J. R. Microsc. Soc. 3 790–812. 10.1111/j.1365-2818.1883.tb05956.x - DOI
    1. Adams S. R., Harootunian A. T., Buechler Y. J., Taylor S. S., Tsien R. Y. (1991). Fluorescence ratio imaging of cyclic AMP in single cells. Nature 349 694–697. 10.1038/349694a0 - DOI - PubMed
    1. Agronskaia A. V., Valentijn J. A., van Driel L. F., Schneijdenberg C. T., Humbel B. M., van Bergen en Henegouwen P. M., et al. (2008). Integrated fluorescence and transmission electron microscopy. J. Struct. Biol. 164 183–189. 10.1016/j.jsb.2008.07.003 - DOI - PubMed
    1. Akagi T., Ishida K., Hanasaka T., Hayashi S., Watanabe M., Hashikawa T., et al. (2006). Improved methods for ultracryotomy of CNS tissue for ultrastructural and immunogold analyses. J. Neurosci. Methods 153 276–282. 10.1016/j.jneumeth.2005.11.007 - DOI - PubMed
    1. Al Jord A., Lemaitre A. I., Delgehyr N., Faucourt M., Spassky N., Meunier A. (2014). Centriole amplification by mother and daughter centrioles differs in multiciliated cells. Nature 516 104–107. 10.1038/nature13770 - DOI - PubMed