

Sex Differences in Age-Related Decline of Urinary Insulin-Like Growth Factor-Binding Protein-3 Levels in Adult Bonobos and Chimpanzees
- PMID: 27602019
- PMCID: PMC4994059
- DOI: 10.3389/fendo.2016.00118
Sex Differences in Age-Related Decline of Urinary Insulin-Like Growth Factor-Binding Protein-3 Levels in Adult Bonobos and Chimpanzees
Abstract
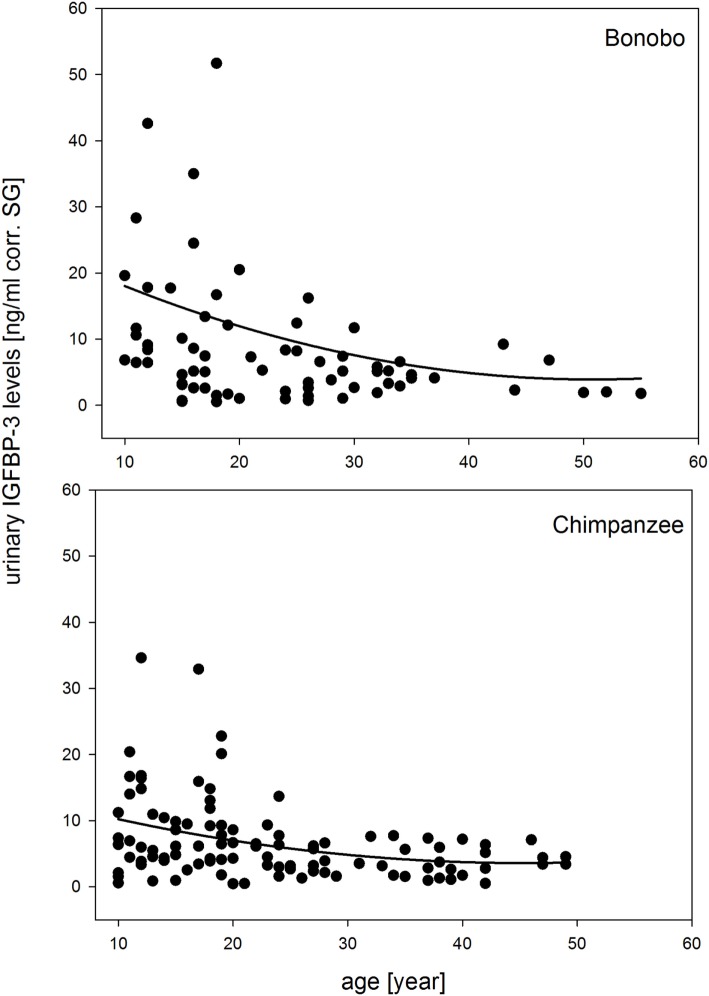
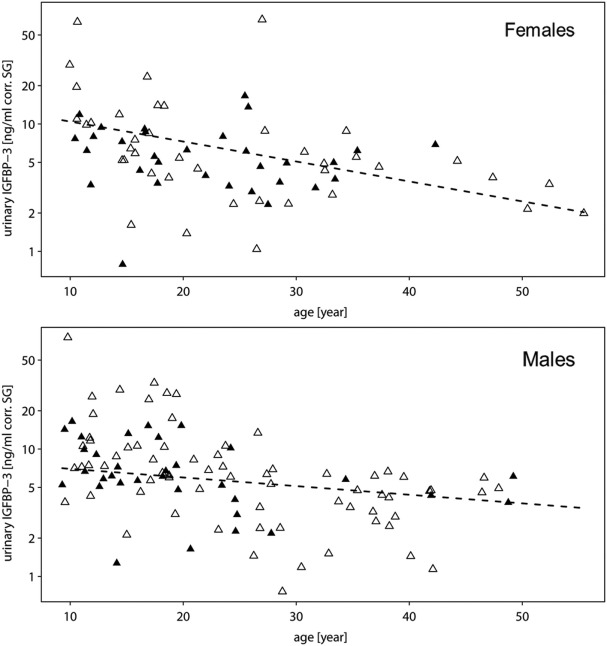
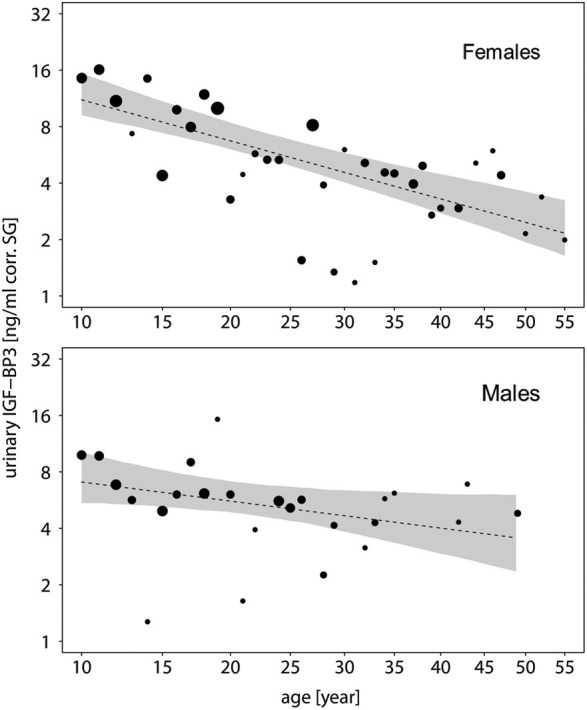
There is increasing interest in the characterization of normative senescence in humans. To assess to what extent aging patterns in humans are unique, comparative data from closely related species, such as non-human primates, can be very useful. Here, we use data from bonobos and chimpanzees, two closely related species that share a common ancestor with humans, to explore physiological markers that are indicative of aging processes. Many studies on aging in humans focus on the somatotropic axis, consisting of growth hormone (GH), insulin-like growth factors (IGFs), and IGF binding proteins (IGFBPs). In humans, IGFBP-3 levels decline steadily with increasing age. We used urinary IGFBP-3 levels as an alternative endocrine marker for IGF-I to identify the temporal pattern known to be related with age-related changes in cell proliferation, growth, and apoptosis. We measured urinary IGFBP-3 levels in samples from 71 bonobos and 102 chimpanzees. Focusing on samples from individuals aged 10 years or older, we found that urinary IGFBP-3 levels decline in both ape species with increasing age. However, in both species, females start with higher urinary IGFBP-3 levels than males, experience a steeper decline with increasing age, and converge with male levels around the age of 30-35 years. Our measurements of urinary IGFBP-3 levels indicate that bonobos and chimpanzees mirror human patterns of age-related decline in IGFBP-3 in older individuals (<10 years) of both sexes. Moreover, such as humans, both ape species show sex-specific differences in IGFBP-3 levels with females having higher levels than males, a result that correlates with sex differences in life expectancy. Using changes in urinary IGFBP-3 levels as a proxy for changes in GH and IGF-I levels that mark age-related changes in cell proliferation, this approach provides an opportunity to investigate trade-offs in life-history strategies in cross-sectional and in longitudinal studies, both in captivity and in the wild.
Keywords: IGFBP-3; aging pattern; ape species; pan paniscus; pan troglodytes; primate; urinary marker.
Figures
Similar articles
-
Aging and sex affect soluble alpha klotho levels in bonobos and chimpanzees.Front Zool. 2018 Sep 19;15:35. doi: 10.1186/s12983-018-0282-9. eCollection 2018. Front Zool. 2018. PMID: 30250491 Free PMC article.
-
Age-related changes in urinary testosterone levels suggest differences in puberty onset and divergent life history strategies in bonobos and chimpanzees.Horm Behav. 2014 Aug;66(3):525-33. doi: 10.1016/j.yhbeh.2014.07.011. Epub 2014 Jul 30. Horm Behav. 2014. PMID: 25086337
-
Normative data for insulin-like growth factors (IGFs), IGF-binding proteins, and growth hormone-binding protein in a healthy Spanish pediatric population: age- and sex-related changes.J Clin Endocrinol Metab. 1993 Dec;77(6):1522-8. doi: 10.1210/jcem.77.6.7505288. J Clin Endocrinol Metab. 1993. PMID: 7505288
-
Serum levels of insulin-like growth factor (IGF)-binding protein-3 (IGFBP-3) in healthy infants, children, and adolescents: the relation to IGF-I, IGF-II, IGFBP-1, IGFBP-2, age, sex, body mass index, and pubertal maturation.J Clin Endocrinol Metab. 1995 Aug;80(8):2534-42. doi: 10.1210/jcem.80.8.7543116. J Clin Endocrinol Metab. 1995. PMID: 7543116
-
Derangements of the somatotropic hormone axis in chronic renal failure.Kidney Int Suppl. 1997 Mar;58:S106-13. Kidney Int Suppl. 1997. PMID: 9067957 Review.
Cited by
-
Aging and sex affect soluble alpha klotho levels in bonobos and chimpanzees.Front Zool. 2018 Sep 19;15:35. doi: 10.1186/s12983-018-0282-9. eCollection 2018. Front Zool. 2018. PMID: 30250491 Free PMC article.
-
Evidence for adolescent length growth spurts in bonobos and other primates highlights the importance of scaling laws.Elife. 2023 Sep 5;12:RP86635. doi: 10.7554/eLife.86635. Elife. 2023. PMID: 37667589 Free PMC article.
-
Insulin-Like Growth Factor-1 in Acute Ischemic Stroke.Egypt J Neurol Psychiatr Neurosurg. 2018;54(1):42. doi: 10.1186/s41983-018-0042-y. Epub 2018 Dec 10. Egypt J Neurol Psychiatr Neurosurg. 2018. PMID: 30595648 Free PMC article.
References
-
- Colman RJ, Kemnitz JW. Aging experiments using nonhuman primates. In: Yu BP, editor. Methods in Aging Research. Boca Raton, FL: CRC Press; (1999). p. 249–70.
-
- Crews D. Human Senescence Evolutionary and Biocultural Perspectives. Cambridge, UK; New York: Cambridge University Press; (2003).
LinkOut - more resources
Full Text Sources
Other Literature Sources
Research Materials
Miscellaneous