

An energetics-based honeybee nectar-foraging model used to assess the potential for landscape-level pesticide exposure dilution
- PMID: 27602273
- PMCID: PMC4991850
- DOI: 10.7717/peerj.2293
An energetics-based honeybee nectar-foraging model used to assess the potential for landscape-level pesticide exposure dilution
Abstract
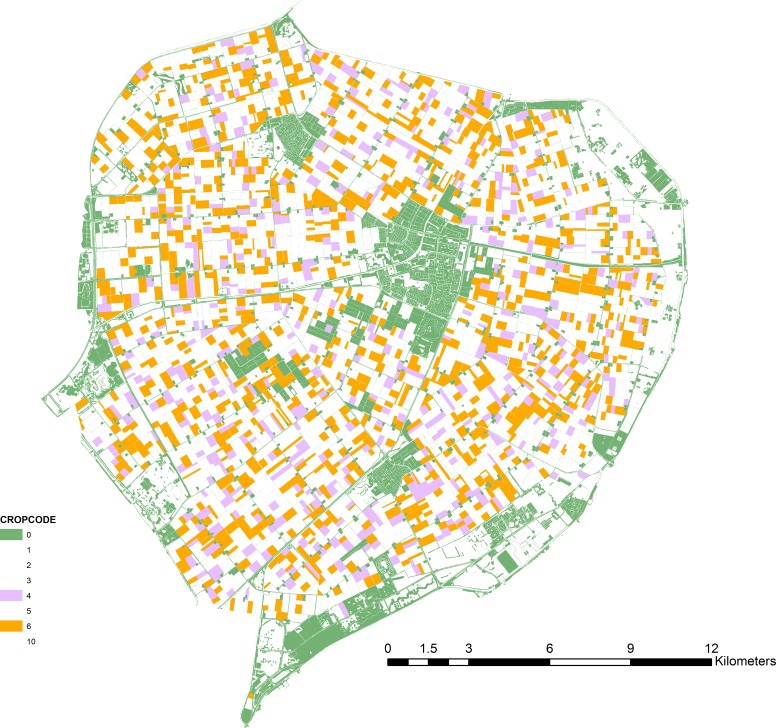
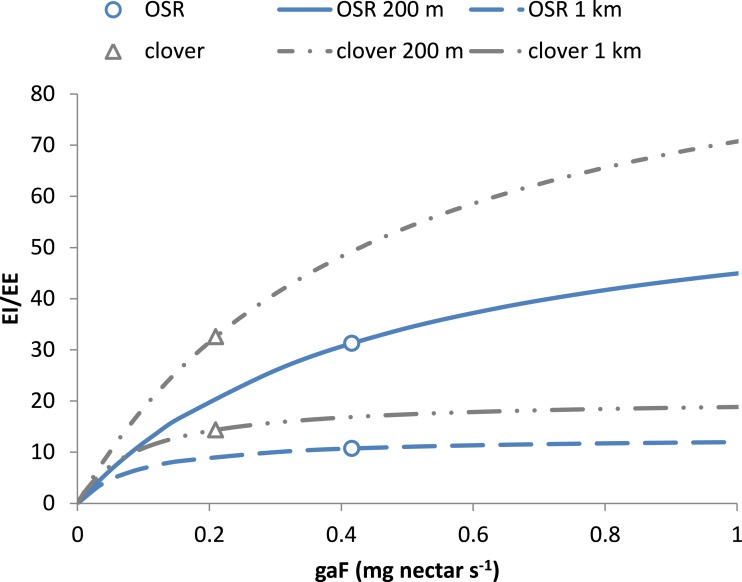
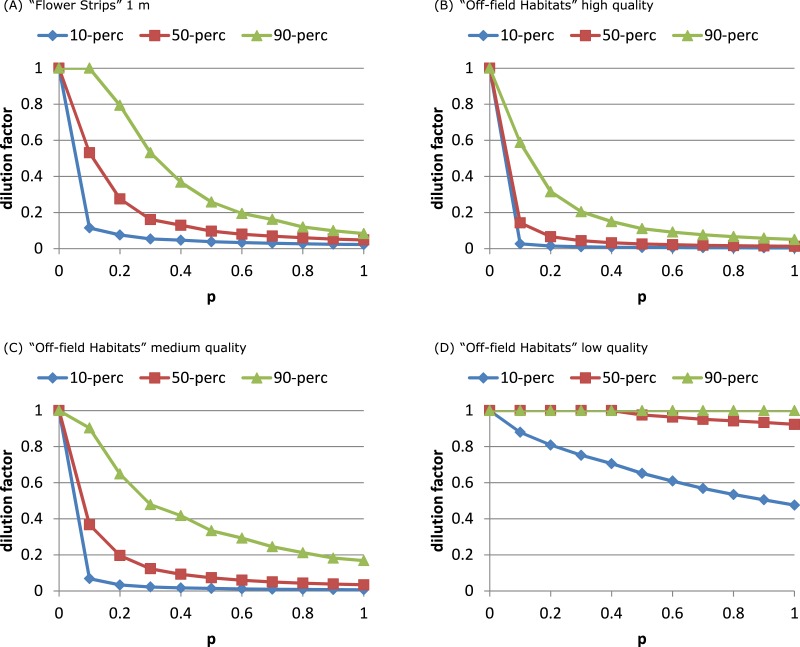
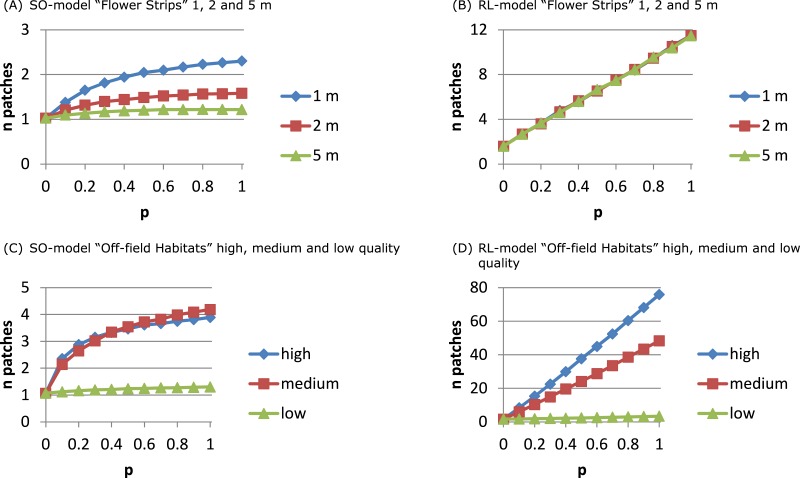
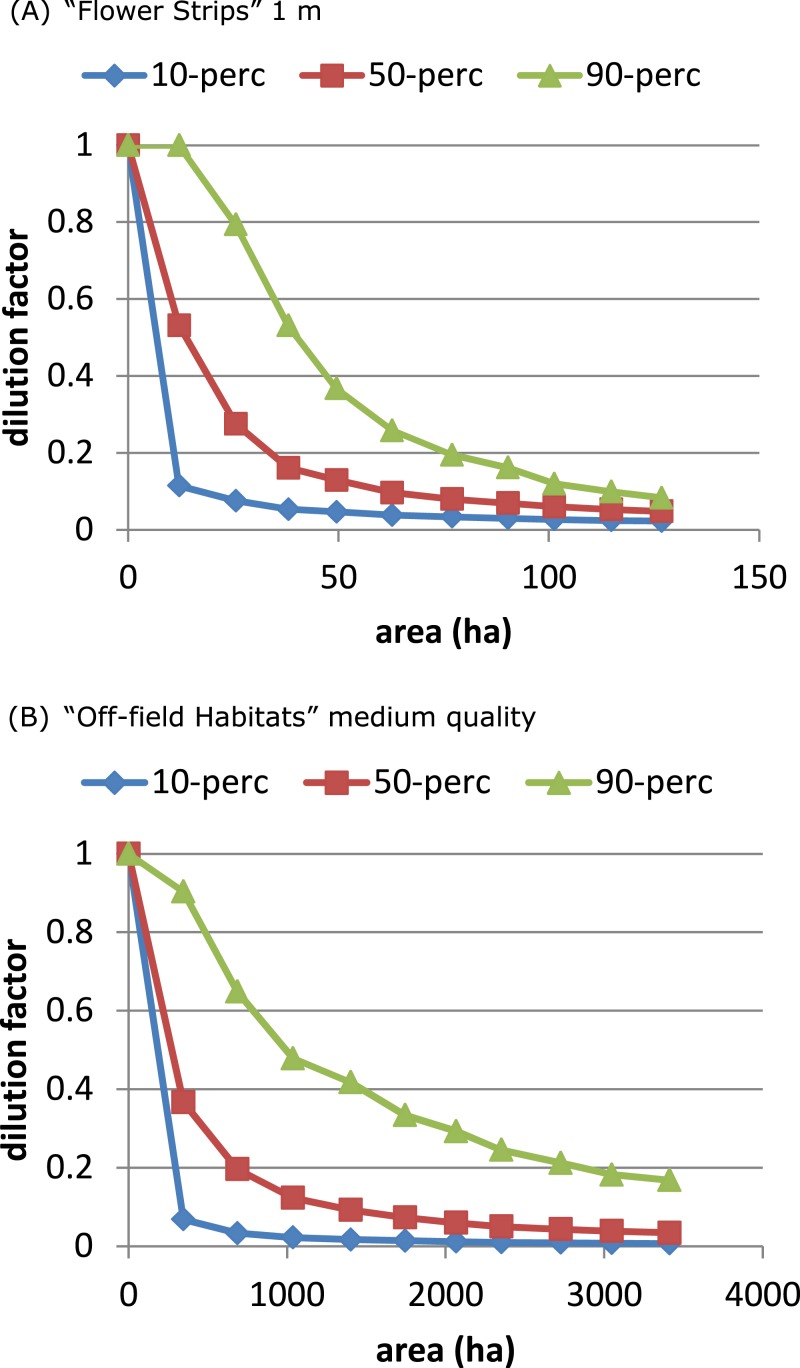
Estimating the exposure of honeybees to pesticides on a landscape scale requires models of their spatial foraging behaviour. For this purpose, we developed a mechanistic, energetics-based model for a single day of nectar foraging in complex landscape mosaics. Net energetic efficiency determined resource patch choice. In one version of the model a single optimal patch was selected each hour. In another version, recruitment of foragers was simulated and several patches could be exploited simultaneously. Resource availability changed during the day due to depletion and/or intrinsic properties of the resource (anthesis). The model accounted for the impact of patch distance and size, resource depletion and replenishment, competition with other nectar foragers, and seasonal and diurnal patterns in availability of nectar-providing crops and wild flowers. From the model we derived simple rules for resource patch selection, e.g., for landscapes with mass-flowering crops only, net energetic efficiency would be proportional to the ratio of the energetic content of the nectar divided by distance to the hive. We also determined maximum distances at which resources like oilseed rape and clover were still energetically attractive. We used the model to assess the potential for pesticide exposure dilution in landscapes of different composition and complexity. Dilution means a lower concentration in nectar arriving at the hive compared to the concentration in nectar at a treated field and can result from foraging effort being diverted away from treated fields. Applying the model for all possible hive locations over a large area, distributions of dilution factors were obtained that were characterised by their 90-percentile value. For an area for which detailed spatial data on crops and off-field semi-natural habitats were available, we tested three landscape management scenarios that were expected to lead to exposure dilution: providing alternative resources than the target crop (oilseed rape) in the form of (i) other untreated crop fields, (ii) flower strips of different widths at field edges (off-crop in-field resources), and (iii) resources on off-field (semi-natural) habitats. For both model versions, significant dilution occurred only when alternative resource patches were equal or more attractive than oilseed rape, nearby and numerous and only in case of flower strips and off-field habitats. On an area-base, flower strips were more than one order of magnitude more effective than off-field habitats, the main reason being that flower strips had an optimal location. The two model versions differed in the predicted number of resource patches exploited over the day, but mainly in landscapes with numerous small resource patches. In landscapes consisting of few large resource patches (crop fields) both versions predicted the use of a small number of patches.
Keywords: Depletion; Energetic efficiency; Flower strips; Foraging; Honeybee; Landscape ecology; Nectar content; Pesticide exposure; Resource selection; Semi-natural habitats.
Conflict of interest statement
The authors declare there are no competing interests.
Figures
References
-
- Beekman M, Bin Lew J. Foraging in honeybees—when does it pay to dance? Behavioral Ecology. 2008;19:255–262. doi: 10.1093/beheco/arm117. - DOI
-
- Beekman M, Oldroyd BP, Myerscough MR. Sticking to their choice—honey bee subfamilies abandon declining food sources at a slow but uniform rate. Ecological Entomology. 2003;28:233–238. doi: 10.1046/j.1365-2311.2003.00491.x. - DOI
-
- Beekman M, Ratnieks FLW. Long-range foraging by the honey-bee, Apis mellifera L. Functional Ecology. 2000;14:490–496. doi: 10.1046/j.1365-2435.2000.00443.x. - DOI
LinkOut - more resources
Full Text Sources
Other Literature Sources
