. 2016 Oct 11;7(41):66906-66921.
doi: 10.18632/oncotarget.11836.

Quantification of nucleic acid quality in postmortem tissues from a cancer research autopsy program

Affiliations

Quantification of nucleic acid quality in postmortem tissues from a cancer research autopsy program

Jun Fan et al. Oncotarget. .

Abstract

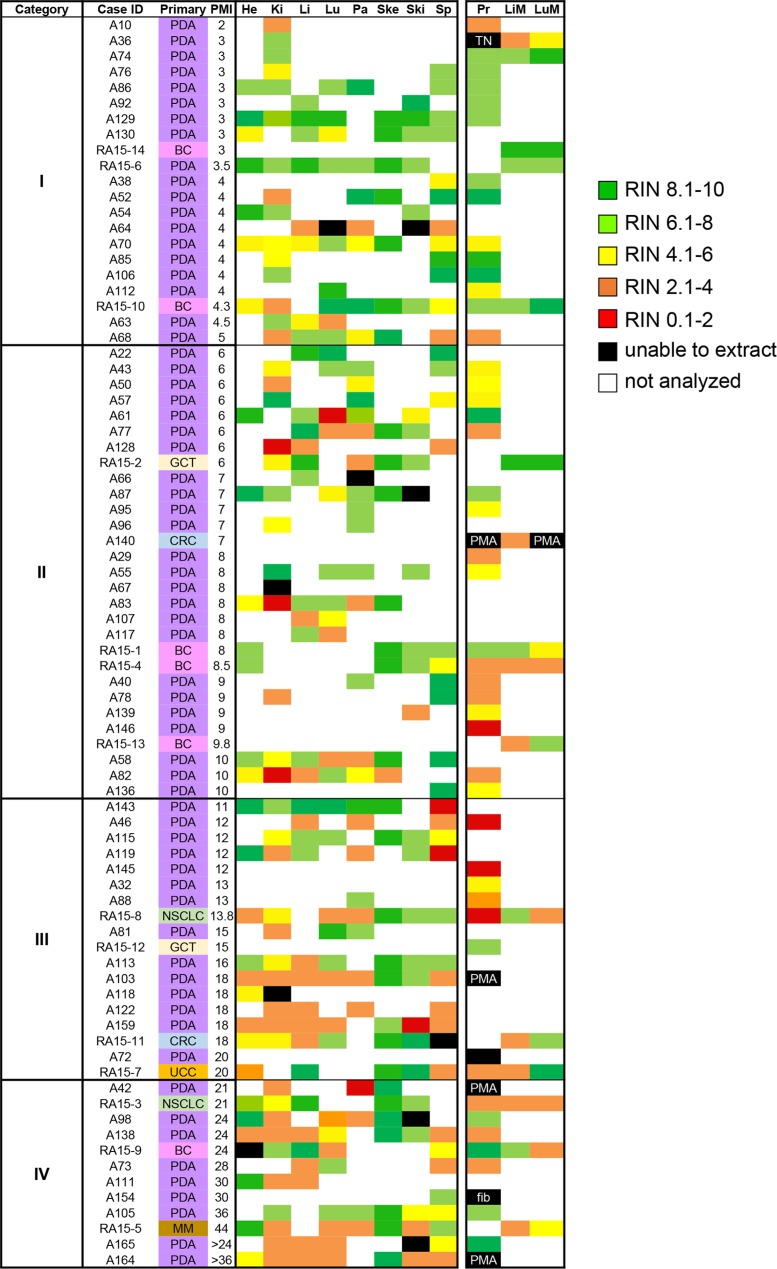
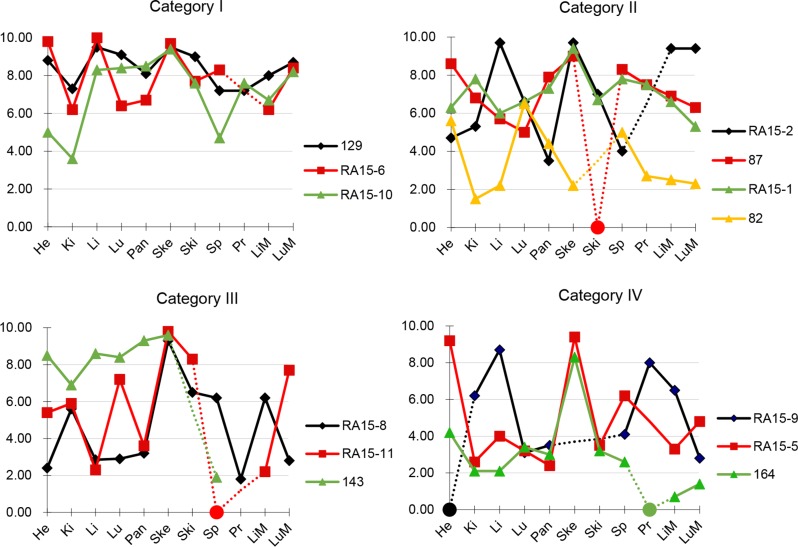
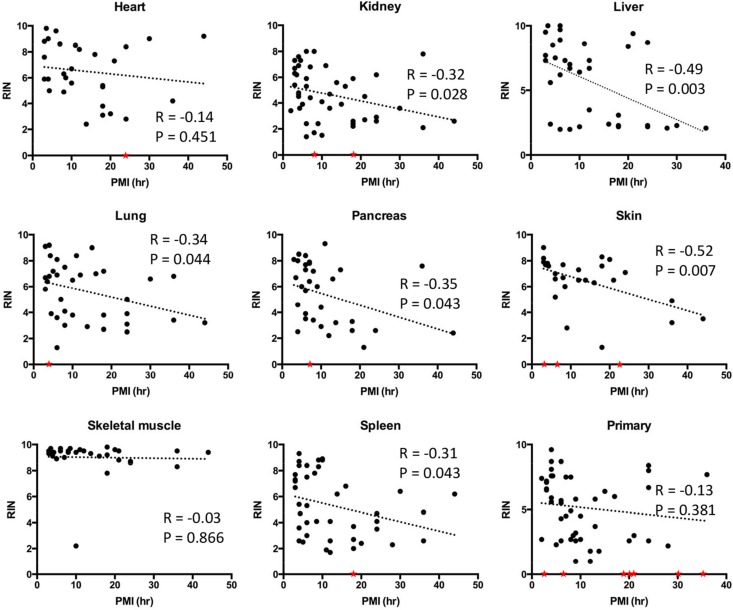
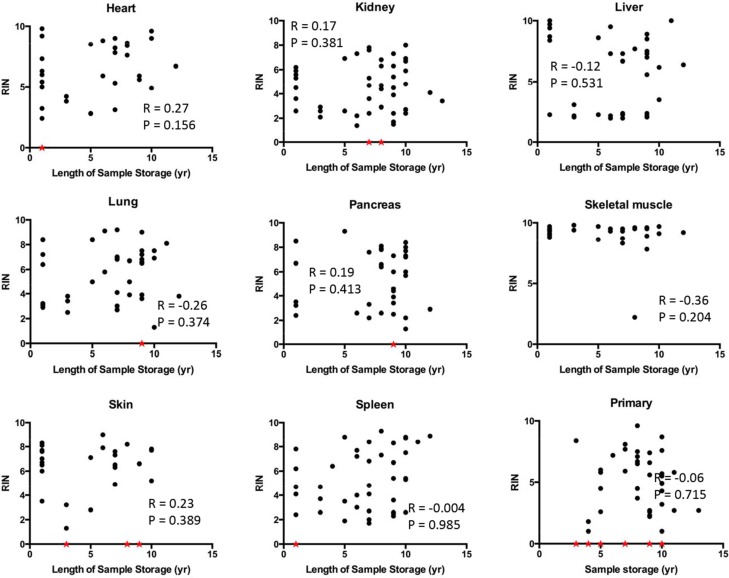
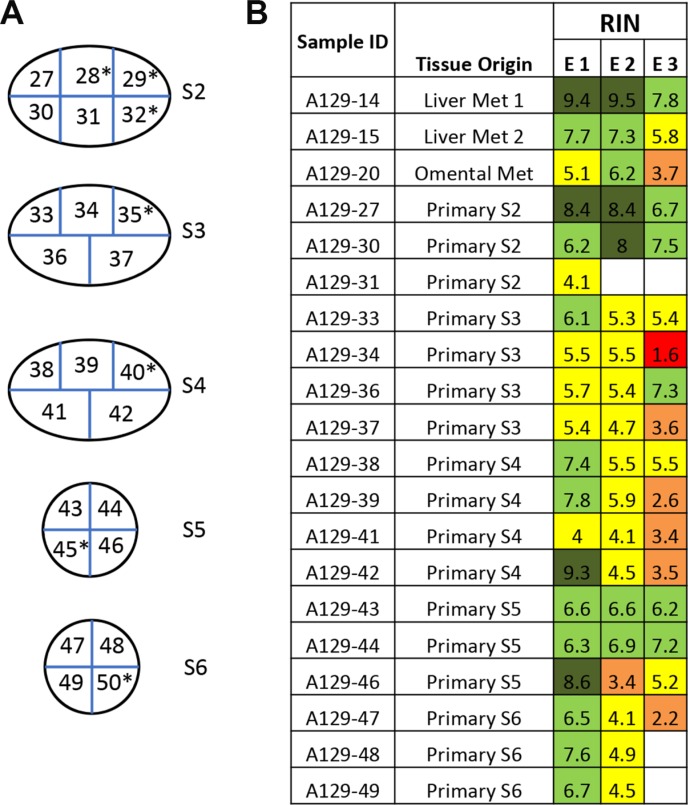
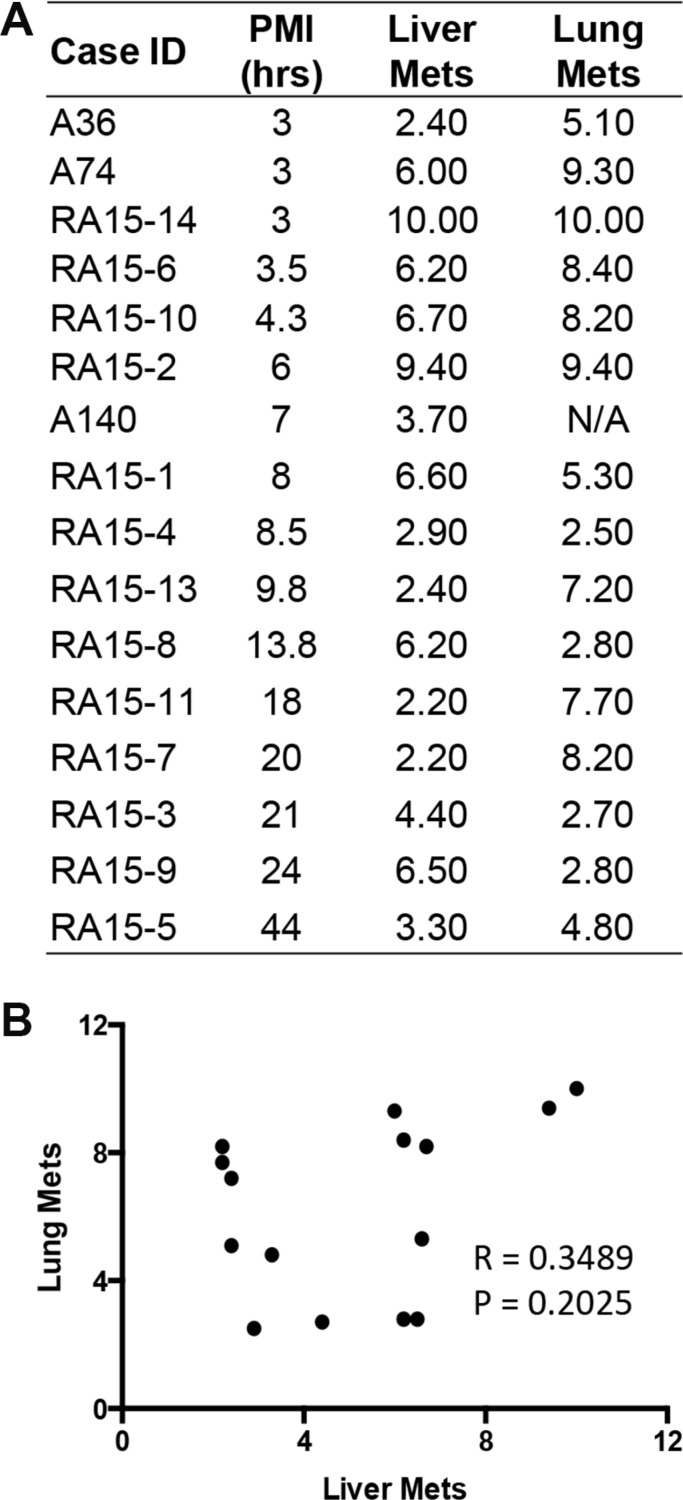
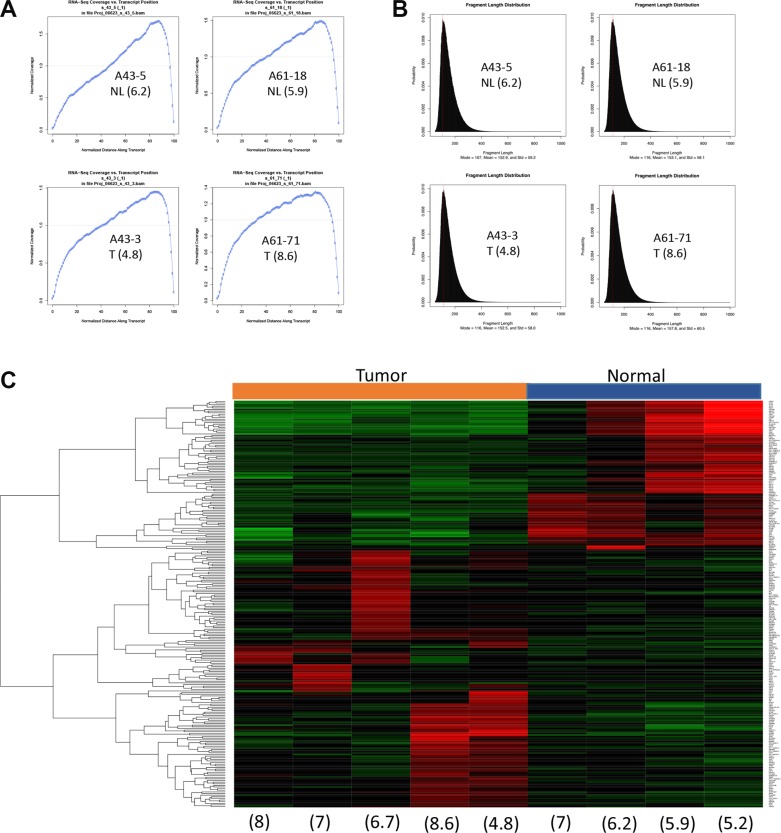
The last decade has seen a marked rise in the use of cancer tissues obtained from research autopsies. Such resources have been invaluable for studying cancer evolution or the mechanisms of therapeutic resistance to targeted therapies. Degradation of biomolecules is a potential challenge to usage of cancer tissues obtained in the post-mortem setting and remains incompletely studied. We analysed the nucleic acid quality in 371 different frozen tissue samples collected from 80 patients who underwent a research autopsy, including eight normal tissue types, primary and metastatic tumors. Our results indicate that RNA integrity number (RIN) of normal tissues decline with the elongation of post-mortem interval (PMI) in a tissue-type specific manner. Unlike normal tissues, the RNA quality of cancer tissues is highly variable with respect to post-mortem interval. The kinetics of DNA damage also has tissue type-specific features. Moreover, while DNA degradation is an indicator of low RNA quality, the converse is not true. Finally, we show that despite RIN values as low as 5.0, robust data can be obtained by RNA sequencing that reliably discriminates expression signatures.

Keywords: RNA; RNA sequencing; autopsy; metastasis; post-mortem.


Conflict of interest statement

CONFLICTS OF INTEREST

The authors have declared no potential conflicts of interest.

Figures

Figure 1
Figure 1. Heat map of RNA integrity numbers by tissue type
RIN values from individual tissues were expressed with colored regions as defined by the accompanying legend. Abbreviations are PDA, pancreatic ductal adenocarcinoma; BC, breast cancer; GCT, germ cell tumor; CRC, colorectal cancer; NSCLC, non-small cell lung cancer; UCC, urothelial cell carcinoma; MM, melanoma; He, heart; Ki, kidney; Li, liver; Lu, Lung; Pa, pancreas; Ski, skin; Sp, spleen; Pr, primary tumor; LiM, liver metastasis; LuM, Lung metastasis. PMA, postmortem autolysis; TN, tumor-associated necrosis; fib, fibrosis.
Figure 2
Figure 2. RNA integrity numbers in patient-matched tissues
RIN values from patient-matched tissues were plotted against tissue types. Selected cases from each of the four PMI categories were shown. Samples with low RNA yield leading to unreported or unreliable RIN were assigned to a RIN value of 0 and indicated by a circle. Dashed lines indicate tissues not analysed for that patient. Abbreviations are He, heart; Ki, kidney; Li, liver; Lu, Lung; Pa, pancreas; Ske, skeletal muscle; Ski, skin; Sp, spleen; Pr, primary tumor; LiM, liver mets; LuM, Lung mets.
Figure 3
Figure 3. Correlations between RNA integrity numbers and post mortem interval by tissue site
Scatter plots were generated by plotting RIN values from each normal tissue type or primary tumors against PMI. Linear regression was performed to create curve fits. Samples with low RNA yield leading to unreported or unreliable RIN were assigned to a RIN value of 0 (red stars) and excluded from linear regression analysis.
Figure 4
Figure 4. Correlation between RIN and sample storage time
Scatter plots were generated by plotting RIN values from each tissue types against sample storage time. Samples with low RNA yield leading to unreported or unreliable RIN were assigned to a RIN value of 0 and indicated by a red star.
Figure 5
Figure 5. Variation of RNA integrity in primary tumors and metastases in a metastatic cancer case A129
(A) One primary pancreatic tumor was bread-loafed as indicated by primary tumor section S2 to S6. Each slice was further cut into equally sized small pieces (approximately 1 × 1 cm) and numbered accordingly to generate sample IDs. Samples with high tumor cellularity were used for RNA extraction and determination of RNA integrity. Samples indicated by an asterisk (*) were excluded due to low tumor cellularity or necrosis. (B) Each piece of tissue was trisected and RNA extracted (E1,E2,E3). The color code for RIN value is the same as in Figure 1.
Figure 6
Figure 6. RNA integrity in patient-matched liver metastases and lung metastases
(A) Numbers listed are the corresponding RIN value for each individual tissue. N/A, data not available due to low RNA yield. (B) Scatter plot was generated by plotting RIN values from liver metastases against that from lung metastases. Pearson r and p values were from correlation analysis.
Figure 7
Figure 7. Detection of DNA damage in autopsy samples
(A) PCR band pattern using control DNA. Lane 1, Intact genomic DNA; Lane 2–4, Genomic DNA sonicated to 500 bp, 300 bp or 150 bp; Lane 5, DNA from a representative frozen autopsy tissue; Lane 6, DNA from a representative formalin-fixed paraffin-embedded (FFPE) tissue sample. (B) Representative PCR band patterns of samples collected from two autopsy cases. In each panel, the first lane is intact genomic DNA and the remaiing lanes correspond to the tissue types shown in (C) Arrows indicate samples with DNA damage. L1, L2, L3, L4 and CL represent locus 1, 2, 3, 4 and control locus, respectively. (C) Relative DNA quality calculated as described in Materials and Methods. Met, metastasis; NL, normal.
Figure 8
Figure 8. RNAseq clearly separates a tumor signature from the normal counterpart
(A) Normalized RNA-seq coverage is plotted against transcript position. (B) Fragment length distribution. Representative samples with wide spectrum of RIN are shown in A and B. (C) Heat map shows expression profile of top 250 differentially expressed genes. Numbers in parenthesis indicate RIN values. Tumor, tissues from primary pancreatic cancer. Normal, tissue from normal pancreas.

References

    1. Clark MJ. Autopsy. Lancet. 2005;366:1767. - PubMed
    1. Scatliff JH, Morris PJ. From Roentgen to magnetic resonance imaging: the history of medical imaging. N C Med J. 2014;75:111–113. - PubMed
    1. Burke MD. Laboratory medicine in the 21st Century. Am J Clin Pathol. 2000;114:841–846. - PubMed
    1. Samarasekera N, Al-Shahi Salman R, Huitinga I, Klioueva N, McLean CA, Kretzschmar H, Smith C, Ironside JW. Brain banking for neurological disorders. Lancet Neurol. 2013;12:1096–1105. - PubMed
    1. Vogelstein B, Papadopoulos N, Velculescu VE, Zhou S, Diaz LA, Jr, Kinzler KW. Cancer genome landscapes. Science. 2013;339:1546–1558. - PMC - PubMed

LinkOut - more resources