. 2016 Sep 7:5:e18413.
doi: 10.7554/eLife.18413.

Distinct stages in stress granule assembly and disassembly

Affiliations

Distinct stages in stress granule assembly and disassembly

Joshua R Wheeler et al. Elife. .

Abstract

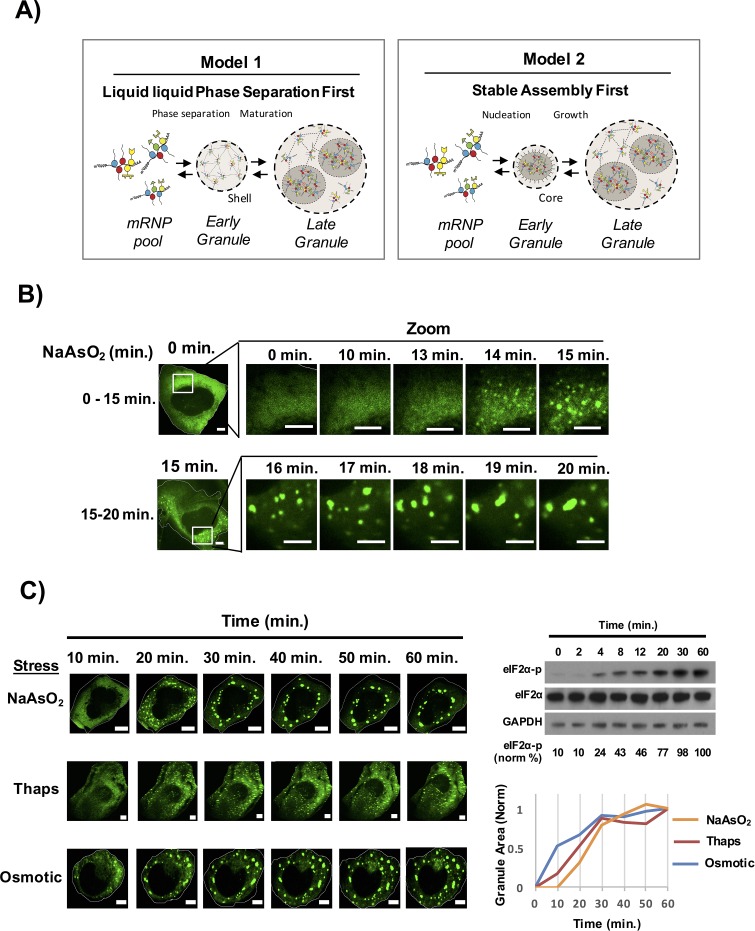
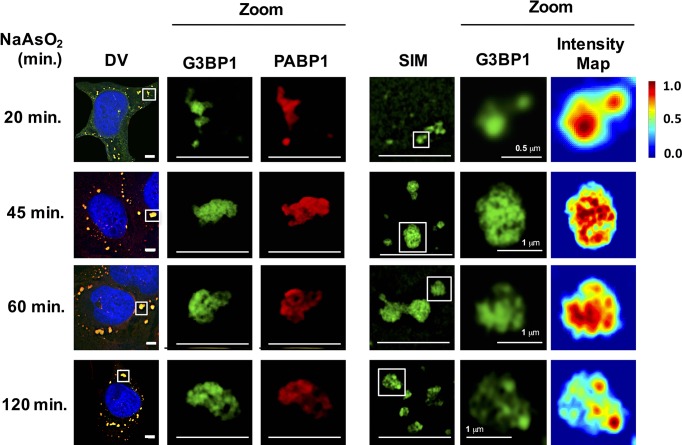
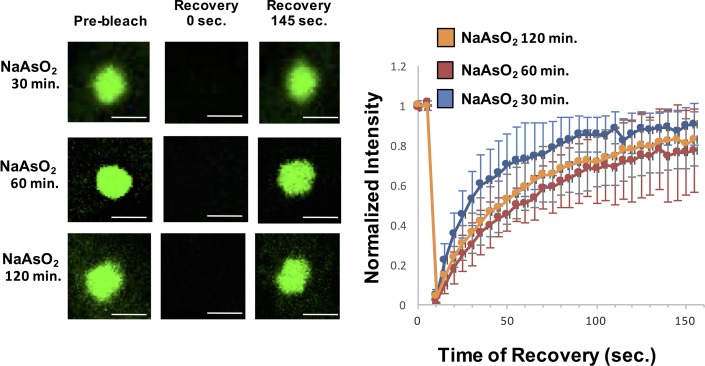
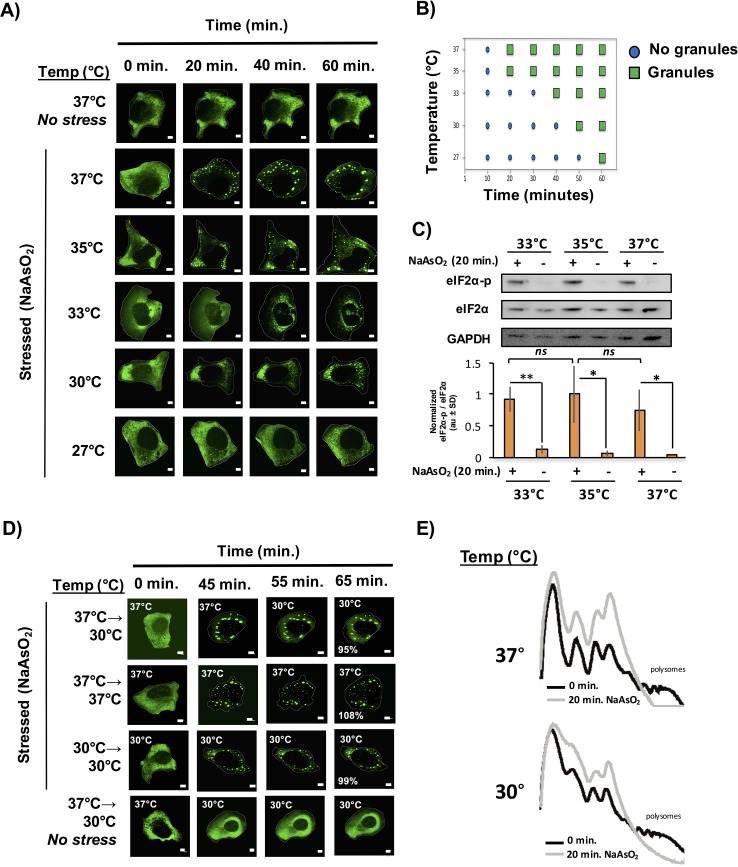
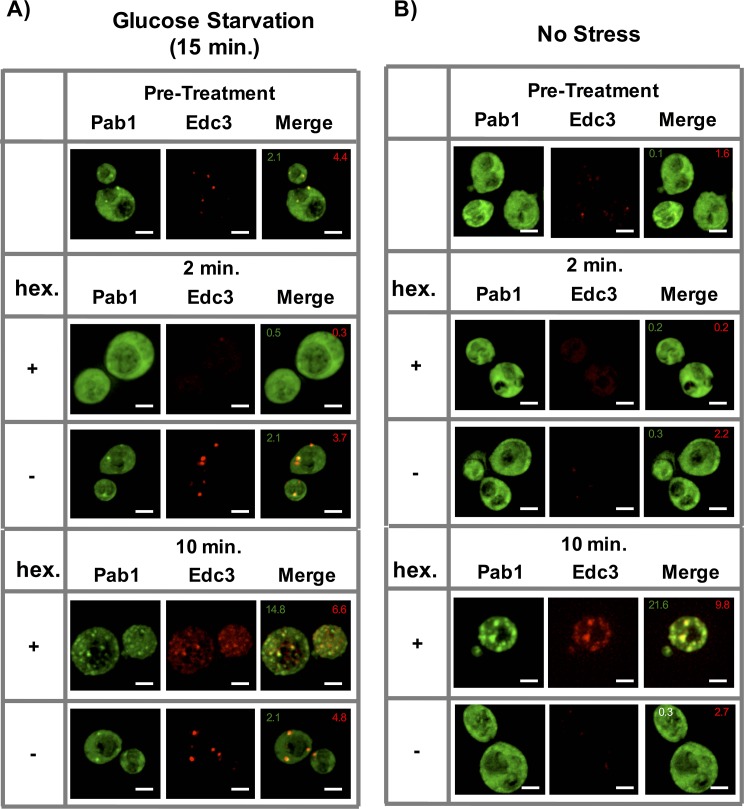
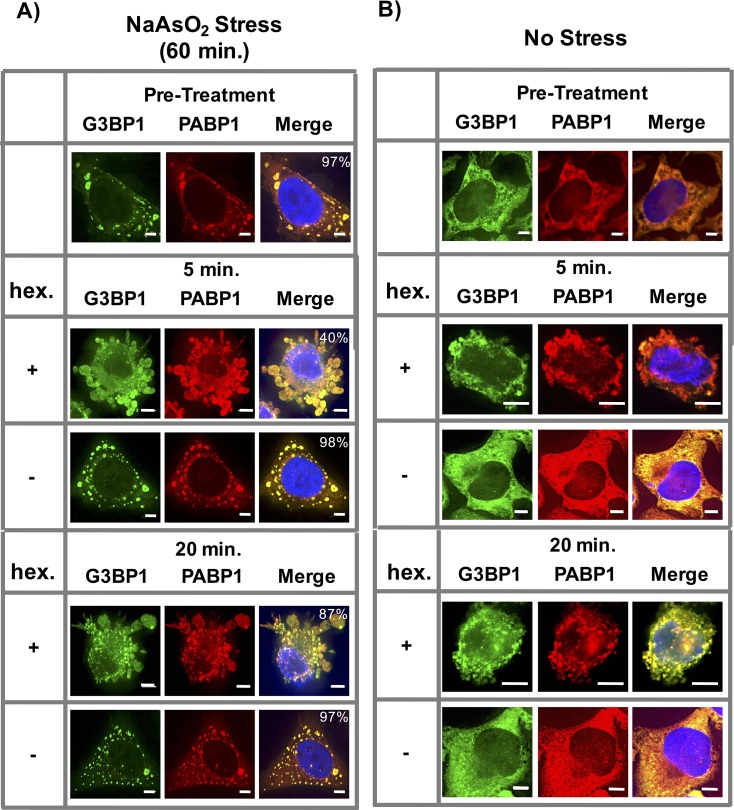
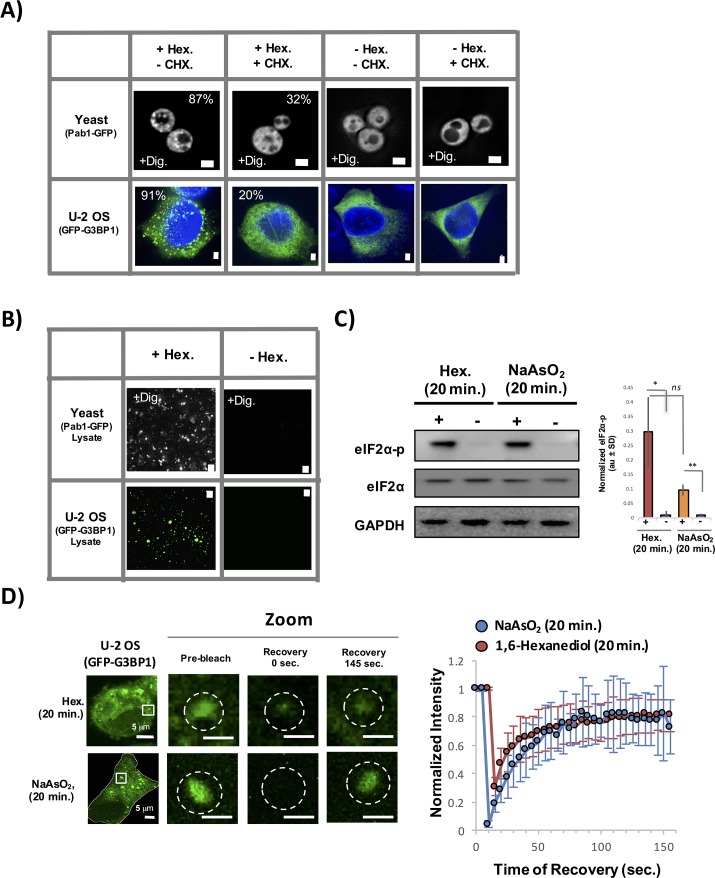
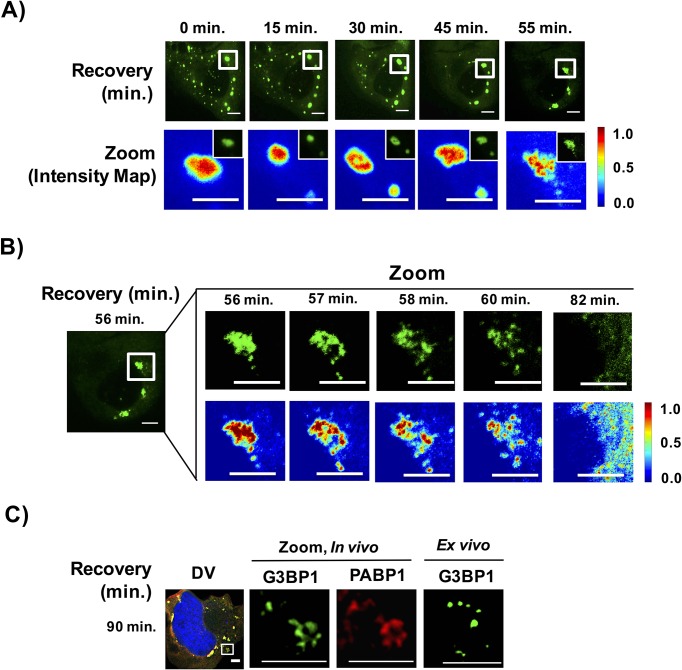
Stress granules are non-membrane bound RNA-protein (RNP) assemblies that form when translation initiation is limited and contain a biphasic structure with stable core structures surrounded by a less concentrated shell. The order of assembly and disassembly of these two structures remains unknown. Time course analysis of granule assembly suggests that core formation is an early event in granule assembly. Stress granule disassembly is also a stepwise process with shell dissipation followed by core clearance. Perturbations that alter liquid-liquid phase separations (LLPS) driven by intrinsically disordered protein regions (IDR) of RNA binding proteins in vitro have the opposite effect on stress granule assembly in vivo. Taken together, these observations argue that stress granules assemble through a multistep process initiated by stable assembly of untranslated mRNPs into core structures, which could provide sufficient high local concentrations to allow for a localized LLPS driven by IDRs on RNA binding proteins.

Keywords: RNP granule; S. cerevisiae; biochemistry; cell biology; human; liquid liquid phase separation; phase transition; stress granule.


Conflict of interest statement

The authors declare that no competing interests exist.

Figures

Figure 1.
Figure 1.. Time course of stress granule assembly.
(A) Two models for stress granule assembly. In Model 1, an increase in a pool of untranslated mRNAs with bound proteins containing IDRs, could lead to the formation of a LLPS based on weak, dynamic IDR-IDR interactions and over time core formation occurs as a second phase due to the supersaturation of local concentration of core components. In Model 2, untranslating mRNAs with bound proteins containing IDRs could initially oligomerize into stable cores that provide a platform for LLPS and eventual coalescence of multiple cores results in formation of a larger LLPS assembly. (B) Time-lapse imaging stress granule assembly and early dynamics in U-2 OS cells expressing GFP-G3BP1 during NaAsO2 stress using 100X objective. (C) Time-lapse imaging of stress granule assembly under NaAsO2 (0.5 mM), thapsigarin (Thaps, 100 nM), or osmotic stress (375 μM sorbitol). Western blot for eiF2α phosphorylation status following exposure to NaAsO2 stress over time. Percent eiF2α phosphorylation was normalized to total eiF2α. eiF2α and GAPDH serve as loading controls. Graph shows average granule area plotted for each stress condition normalized to maximal granule area at 60 min. All scale bars are 5 μm. DOI: http://dx.doi.org/10.7554/eLife.18413.002
Figure 2.
Figure 2.. Stress granule cores are stable in lysates early in granule assembly.
(A) GFP-G3BP1 U-2 OS cells and cell lysates following treatment with NaAsO2 for 15 min. Graph shows percent GFP-G3BP1 foci for cells (in vivo) and cell lysates (in vitro) and normalized to maximal number of foci detected at 15 min (in vivo) or number of foci detected at time 0 min (in vitro). (B) GFP-G3BP1 U-2 OS cells and cell lysates probed for the stress granule markers, PABP1 or eIF4G following treatment with NaAsO2 for 15 min. GFP-G3BP1 foci in lysates probed for poly (A+) RNA by oligo-dT or secondary-only antibody from cells NaAsO2 stressed for 15 min. GFP-G3BP1 foci in lysates were probed with secondary antibody only (Alexa-647) at same concentrations used for primary (PABP1 or eIF4G) antibody detection. Zoom represents magnified inset. Unless otherwise noted, all scale bars are 5 μm. DOI: http://dx.doi.org/10.7554/eLife.18413.004
Figure 3.
Figure 3.. Early and late stress granules contain a non-uniform substructure.
GFP-G3BP1 stress granules were stained with the stress granule marker PABP1 and imaged by deconvolution microscopy (DV) following NaAsO2 stress at different time points. GFP-G3BP1 was assessed in the same cells by structured illumination microscopy (SIM). Intensity map represents relative gray scale intensity. Zoom represents magnified inset. Unless otherwise noted, all scale bars are 5 μm. DOI: http://dx.doi.org/10.7554/eLife.18413.005
Figure 4.
Figure 4.. Similar GFP-G3BP1 stress granule core size during early and prolonged stress.
Mean of 3 Nanosight experiments ± standard deviation for GFP-G3BP1 mammalian stress granule cores isolated from U-2 OS cells stressed with NaAs02 for 15, 30, 60, or 120 min. Relative number of particles for each time point are represented as a percentage of maximal number of particles per unit size. Mean median from these 3 experiments is highlighted. Representative images from GFP-G3BP1 cores in lysates at respective time points are shown. All scale bars are 5 μm. DOI: http://dx.doi.org/10.7554/eLife.18413.006
Figure 5.
Figure 5.. Similar GFP-G3BP1 stress granule dynamics during early and prolonged stress.
Granules shown prior to photobleaching, at 0 s, and at 145 s after photobleaching. Cells were treated for either 30, 60, 120 min with NaAsO2. Graph shows recovery curves as an average of 6 granules ± standard deviation at each respective time point. Scale bars are 1.5 μm. DOI: http://dx.doi.org/10.7554/eLife.18413.007
Figure 6.
Figure 6.. Temperature inversely affects kinetics of stress granule formation.
(A) Time-lapse microscopy of U-2 OS cells expressing GFP-G3BP1. U-2 OS cells imaged at respective temperatures in the presence of NaAsO2 stress for 1 hr using 100X objective. (B) Graphical representation of temperature on stress granule formation in U-2 OS cells. (C) Western blot for eiF2α phosphorylation status following +/− exposure to 20 min of NaAsO2 stress at respective temperatures. eiF2α and GAPDH serve as loading controls. Normalized to total eiF2α (N=3, au = arbitary units, SD = standard deviation). (p-value: *<0.05; **<0.01; ns = not significant). (D) Time-lapse microscopy of U-2 OS cells expressing GFP-G3BP1 at respective temperatures following 45 min NaAsO2 stress using 100X objective. Temperatures at which cells were imaged are indicated in top left of each panel. Percentages listed in final panel represent average area of granules normalized to the area of granules at the start of image acquisition. (E) Polysome analysis of U-2 OS cells (grown either at 30°C or 37°C) during steady state or following 20 min NaAsO2 stress. All scale bars are 5 μm. DOI: http://dx.doi.org/10.7554/eLife.18413.008
Figure 7.
Figure 7.. 1,6-Hexanediol disrupts many cellular structures in yeast and alters cellular morphology in HeLa cells.
(A) The localization of various GFP-tagged proteins is shown either without treatment (No Drug); in the presence of 10% 1,6-Hexanediol and 10 μg/mL Digitonin for 2 min or 30 min; or just 10 μg/mL Digitonin for 2 min or 30 min. For Nsp1-GFP and Atp1-GFP, white lines depict cell boundaries. N. Pore = nuclear pore. ER = Endoplasmic Reticulum. Mito. = Mitochondria. Get1, Guided Entry of Tail-anchored proteins (YGL020C). Atp1, ATP synthase (YBL099W). Scale bar is 2 μm. (B) Time-lapse microscopy of HeLa cells treated with 3.5% 1,6-Hexanediol reveals alterations in cellular morphology. HeLa cells were exposed to 3.5% 1,6-Hexanediol (time zero) and imaged for 5 min using a 20X objective. Scale bars are 20 μm. DOI: http://dx.doi.org/10.7554/eLife.18413.009
Figure 8.
Figure 8.. Effect of 1,6-Hexanediol on stress granules and P-bodies in yeast.
(A) Localization of Pab1-GFP and Edc3-mCherry prior to treatment with (Pre-treat) or after 2 min or 10 min of 10 μg/mL Digitonin ±10% 1,6-Hexanediol following 15 min of glucose starvation. All cells continue to be in media lacking glucose throughout the course of the experiment. (B) Same as (A), after 10 μg/mL Digitonin ±10% 1,6-Hexanediol treatment only. Numbers in green (or white) indicate average number of stress granules/ cell. Numbers in red indicate average number of P-bodies/ cell. All scale bars are 2 μm. DOI: http://dx.doi.org/10.7554/eLife.18413.011
Figure 9.
Figure 9.. 1,6-Hexanediol induces formation of stress granule-like assemblies in HeLa cells.
(A) Affects of 1,6-Hexanediol on NaAsO2-induced stress granules in HeLa cells. HeLa cells were stressed with NaAsO2 for 60 min. Addition of 3.5% 1,6-Hexanediol in the presence of NaAsO2 was added at indicated time points. For all experiments, HeLa cells were fixed and co-stained for G3BP1 (FITC labeled secondary) and PABP1 (Alexa-647 labeled secondary). Percentages refer to cells with stress granules defined as G3BP1 and PABP1 double positive foci (N=3 per condition, 50 cells/ replicate). (B) 1,6-Hexanediol induces stress granule formation in HeLa cells. HeLa cells were exposed to media containing 3.5% 1,6-Hexanediol for indicated time periods. All scale bars are 5 μm. DOI: http://dx.doi.org/10.7554/eLife.18413.012
Figure 10.
Figure 10.. Stress granules induced by 1,6-Hexanediol are cyclohexamide sensitive, stable in lysates, and dynamic.
(A) 1,6-Hexanediol induced stress granules are cyclohexamide sensitive in yeast and U-2 OS cells. Yeast were grown in the presence of 10% 1,6-Hexanediol and 10 μg/mL Digitonin for 10 min or just 10 μg/mL Digitonin ± cyclohexamide (100 μg/mL). U-2 OS cells were exposed to media containing 3.5% 1,6-Hexanediol for 20 min ± cyclohexamide (10 μg/mL). Percentages refer to cells with stress granules (N=3 per condition). (B) Yeast and U-2 OS 1,6-Hexanediol induced granules are stable in lysates. Yeast were grown in presence of 1,6-Hexanediol and 10 μg/mL Digitonin for 10 min or just 10 μg/mL Digitonin prior to lysis. Mammalian cells were grown in the presence or absence of 3.5% 1,6-Hexanediol containing media for 15 min prior to lysis. (C) Western blot for eiF2α phosphorylation status following +/− exposure to 1,6-Hexanediol (3.5%) or NaAsO2 (0.5 mM) stress for 20 min. Normalized to eiF2α and GAPDH (N=3, au = arbitary units, SD = standard deviation). (p-value: *<0.01; **<0.001; ns = not significant). (D) Granules shown prior to photobleaching, at 0 s, and at 145 s after photobleaching. Cells were treated with either 1,6-Hexanediol or NaAsO2 for 20 min. Graph shows recovery curves as an average of 6 granules ± standard deviation for each respective condition. Abbreviations: Hex., 1,6-Hexanediol; Dig., Digitonin; CHX, cyclohexamide. All scale bars are 2 μm unless otherwise noted. DOI: http://dx.doi.org/10.7554/eLife.18413.013
Figure 11.
Figure 11.. Stress granules disassemble through multiple discrete steps.
(A) Time-lapse imaging of stress granule disassembly in normal media following 60 min of NaAsO2 stress using a 100X objective. Intensity map represents relative gray scale intensity of zoomed inset. (B) Same as (A) imaged during stress granule fracturing. (C) In vivo GFP-G3BP1 stress granules were stained with PABP1 (Alexa-647 labeled secondary) and ex vivo GFP-G3BP1 stress granules cores imaged by deconvolution microscopy (DV) following 90 min of recovery from NaAsO2 stress. All scale bars are 5 μm. DOI: http://dx.doi.org/10.7554/eLife.18413.014
Figure 12.
Figure 12.. Model for distinct stages of stress granule assembly and disassembly
Possible steps in granule assembly and disassembly are shown. Untranslating mRNPs nucleate an early stable mRNP (core) complex and grow to rapidly include an early core/ shell (biphasic) assembly through an ATP-dependent, microtubule-independent process. Fusion of biphasic stress granules forms a larger higher order mature assembly in part by a microtubule-dependent process. Disassembly is likely to occur through shell dissipation by exchange of weakly associated granule (shell) mRNPs into a recovering translational mRNP pool. More stable core assemblies may then be disassembled by ATP-requiring remodeling complexes or autophagy. Dashed lines between mRNPs represent weak physical interactions in phase-separated shell (light gray). Red wavy lines represent strong interactions between IDRs in stable cores (darker gray). DOI: http://dx.doi.org/10.7554/eLife.18413.016

References

    1. Brangwynne CP. Phase transitions and size scaling of membrane-less organelles. The Journal of Cell Biology. 2013;203:875–881. doi: 10.1083/jcb.201308087. - DOI - PMC - PubMed
    1. Brangwynne CP, Eckmann CR, Courson DS, Rybarska A, Hoege C, Gharakhani J, Jülicher F, Hyman AA. Germline P granules are liquid droplets that localize by controlled dissolution/condensation. Science. 2009;324:1729–1732. doi: 10.1126/science.1172046. - DOI - PubMed
    1. Brangwynne CP, Tompa P, Pappu RV. Polymer physics of intracellular phase transitions. Nature Physics. 2015;11:899–904. doi: 10.1038/nphys3532. - DOI
    1. Buchan JR, Kolaitis RM, Taylor JP, Parker R. Eukaryotic stress granules are cleared by autophagy and Cdc48/VCP function. Cell. 2013;153:1461–1474. doi: 10.1016/j.cell.2013.05.037. - DOI - PMC - PubMed
    1. Buchan JR, Parker R. Eukaryotic stress granules: the ins and outs of translation. Molecular Cell. 2009;36:932–941. doi: 10.1016/j.molcel.2009.11.020. - DOI - PMC - PubMed

MeSH terms