. 2016 Dec 6;7(49):80521-80542.
doi: 10.18632/oncotarget.11825.

Hypoxia promotes glioma-associated macrophage infiltration via periostin and subsequent M2 polarization by upregulating TGF-beta and M-CSFR

Affiliations

Hypoxia promotes glioma-associated macrophage infiltration via periostin and subsequent M2 polarization by upregulating TGF-beta and M-CSFR

Xiaofan Guo et al. Oncotarget. .

Abstract

Tumor-associated macrophages (TAMs) are enriched in gliomas and help create a tumor-immunosuppressive microenvironment. A distinct M2-skewed type of macrophages makes up the majority of glioma TAMs, and these cells exhibit pro-tumor functions. Gliomas contain large hypoxic areas, and the presence of a correlation between the density of M2-polarized TAMs and hypoxic areas suggests that hypoxia plays a supportive role during TAM recruitment and induction. Here, we investigated the effects of hypoxia on human macrophage recruitment and M2 polarization. We also investigated the influence of the HIF inhibitor acriflavine (ACF) on M2 TAM infiltration and tumor progression in vivo. We found that hypoxia increased periostin (POSTN) expression in glioma cells and promoted the recruitment of macrophages. Hypoxia-inducible POSTN expression was increased by TGF-α via the RTK/PI3K pathway, and this effect was blocked by treating hypoxic cells with ACF. We also demonstrated that both a hypoxic environment and hypoxia-treated glioma cell supernatants were capable of polarizing macrophages toward a M2 phenotype. ACF partially reversed the M2 polarization of macrophages by inhibiting the upregulation of M-CSFR in macrophages and TGF-β in glioma cells under hypoxic conditions. Administering ACF also ablated tumor progression in vivo. Our findings reveal a mechanism that underlies hypoxia-induced TAM enrichment and M2 polarization and suggest that pharmacologically inhibiting HIFs may reduce M2-polarized TAM infiltration and glioma progression.

Keywords: M2 macrophage; acriflavine; glioma; hypoxia; tumor-associated macrophage.


Conflict of interest statement

CONFLICTS OF INTEREST

No potential conflicts of interest were disclosed.

Figures
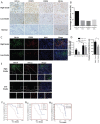
Figure 1
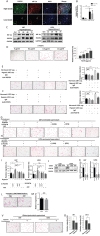
Figure 1. Hypoxia, POSTN expression, TAM infiltration and the proportion of M2 subtype TAMs increased as the grade of glioma increased, and all were correlated with a worse prognosis
A. IHC staining for POSTN, HIF-1α, CD11b and CD206 in four consecutive tissue slides obtained from gliomas with different grades and normal brain tissue specimens. Scale bars, 50 μm. B. A graphical analysis of (A). In all, 47.8% of the glioma cases showed POSTN+ and HIF-1α+ staining, and 16.9% and 15.5% of the GBM cases showed single-positive cells that were POSTN+/HIF-1α- or POSTN-/HIF-1α+, respectively. Only 19.8% of the cases showed both types of negative staining. C. Immunofluorescence staining for the TAM marker CD11b (green) and the M2 type TAM marker CD206 (red). D. A graphical analysis of figure (C) showing that TAM infiltration and the proportion of M2 type cells increased as the grade of the glioma increased. TAM density was analyzed using ImageJ. *, P <0.05; **, P <0.01; ***, P <0.001 (n =5 tumors; mean ± s.e.m.; two-tailed unpaired t-test). E. Immunofluorescence analysis of CD11b (green) and HIF-1α (red) expression in glioma tissue slides showing that TAMs are enriched in HIF-1α-abundant regions. The areas indicated in the squares are enlarged and shown under each picture. Scale bars, 200 μm. F and G. Kaplan-Meier curves analysis of 22 glioma patients with positive POSTN staining and 20 patients with negative POSTN staining showing that the POSTN+ group had a worse prognosis (median survival: 398 days and 311 days, respectively, Log Rank test, p<0.05). In addition, among the 22 POSTN-positive patients, the HIF-1α-positive patients had even worse prognoses (median survival: 378 days vs 218 days, Log Rank test, p<0.05). H. Glioma patients with high CD11b+ TAM infiltration in their tumors had shorter postsurgical survival times than those with low CD11b expression (median survival: 391 days vs 311 days, Log Rank test, n=42, p<0.05, the patients' information was shown in Supplementary Table S1).
Figure 2
Figure 2. Hypoxia-inducible POSTN secretion by glioma cells promotes the recruitment of macrophages
A. Immunofluorescence staining for POSTN (green) and HIF-1α (red). Scale bars, 100 μm. B. A graphical analysis of figure (A) showing that both HIF-1α and POSTN expression increased as the grade of the glioma increased. HIF-1α and POSTN expression was analyzed with ImageJ. *, P <0.05; **, P <0.01 (n =5 tumors; mean ± s.e.m.; two-tailed unpaired t-test). C. Western blot analysis of POSTN and HIF-1α levels in U87 and U251 cells that were exposed to hypoxia showing that they increased over the time-course. D. Representative images of THP-1 macrophage-like cells migrating towards different concentrations of rPOSTN in transwell assays. Scale bar, 100 μm. Graphical analysis of (D)showing that THP-1 induced macrophages to migrate towards rPOSTN in a dose-dependent manner. E and F. Representative images of THP-1 macrophage-like cells migrating towards normoxia- or hypoxia- treated U87 or U251 cell culture supernatants pre-incubated with or without anti-POSTN antibodies. A graphical analysis of (E) and (F) shows that the increased macrophages migration toward hypoxia-treated glioma cell supernatants was attenuated by the application of anti-POSTN antibodies. Scale bar, 100 μm. G and H. Representative images of THP-1 macrophage-like cells migrating towards different conditioned culture supernatants that were obtained from U87 and U251 cells. I. A graphical analysis of (E) and (F) showing that the increased migration observed in THP-1 induced macrophages toward hypoxia-treated U87 and U251 cell supernatants was reversed by transfecting the cells with siPOSTN before the induction of hypoxia. Moreover, pretreatment of U87 or U251 cells with ACF during exposure to hypoxia also eliminated this trend. J. Western blot analysis of POSTN levels in U87 or U251 cells that were transfected with siPOSTN (1205 or 876) or vector. K. A graphical analysis of (J) showing that there was a significant decrease in POSTN expression in the siPOSTN groups in both U87 and U251 cells. The relative POSTN expression level was determined using ImageJ software. The results are shown as the means ± s.e.m. (n = 3; *, P <0.05; two-tailed unpaired t-test). L. Representative images of THP-1 macrophages migrating toward complete PRIM-1640 medium in the presence of PBS or ACF (3 μM). M. A graphical analysis of (L) showing that ACF had no direct effect on macrophage migration. V. Representative images of THP-1 macrophages migrating towards the conditioned medium of U87/U251 cells when exposed to a normoxic or hypoxic environment. O. A graphical analysis of (V) showing that the migratory activity of macrophages was impaired by hypoxia. All transwell assays were repeated three times. *, P <0.05; **, P <0.01; NS, P >0.05 (n = 5 fields, mean ± s.e.m., two-tailed unpaired t-test).
Figure 3
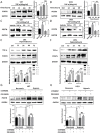
Figure 3. Hypoxia increased the secretion of TGF-α, which subsequently enhanced the expression of POSTN via the RTK/PI3K pathway in U87 and U251 cells
A and B. U87 and U251 cells were treated with 10 ng/ml TGF-α for 12, 24 and 48 h. The protein expression level of POSTN was then analyzed (one way Anova test). C and D. U87 and U251 cells were pretreated with vehicle (DMSO), PD153035 (10 μM) or LY294002 (10 μM) for 1 h before TGF-α was added for 48 h. POSTN expression was then analyzed (two-tailed unpaired t-test). E and F. TGF-α and POSTN expression were increased by hypoxia stimulation in a time-dependent manner. The expression of TGF-α and POSTN were analyzed (one way Anova test). G and H. The hypoxia-induced upregulation of POSTN was attenuated by pretreating the cells with the signaling pathway inhibitors LY294002 (10 μM) or PD153035 (10 μM) for 1 h before the cells were exposed to normoxic or hypoxic conditions (two-tailed unpaired t-test). The results are shown as the means ± s.e.m, n = 3. The protein expression levels were analyzed with ImageJ. *, P <0.05; **, P <0.01 ***, P <0.001; NS, P>0.05.
Figure 4
Figure 4. Changes in cell morphology and surface markers in HMDMs exposed to different hypoxic conditions
We refer to the two hypoxic conditions using the following abbreviations: N+N-U87 sup., macrophages were exposed to a normoxic environment and normoxia-treated U87 cell culture supernatants; and H+H-U87 sup., macrophages were exposed to a hypoxic environment and hypoxia-treated U87 cell culture supernatants. A. Representative images of human monocytes that were cultured for 7 days with M-CSF or GM-CSF under normoxic or hypoxic conditions. Scale bars, 50 μm. B. Representative images of human monocytes that were cultured for 7 days with GM-CSF in the presence of N+N-U87 sup., N+H-U87 sup., H+N-U87 sup. or H+H-U87 sup. Scale bars, 50 μm. C. The same protocol was followed to culture human monocytes with U251 cell supernatants. Scale bars, 50 μm. D. A graphical analysis of (A) showing that hypoxia increased the proportion of rod-like macrophages in cell cultures that were stimulated using M-CSF. However, the percentage of rod-like cells in the macrophages that were induced using GM-CSF was not significantly changed whether or not the cells was stimulated with hypoxia. E and F. A graphical analysis of (B and C) showing that both a hypoxic environment and hypoxia-conditioned U87/U251 cell supernatants were able to increase the percentage of rod-like HMDMs. *, P <0.05. NS, P >0.05 (n =3 healthy donor MDMs, 5 fields were used to calculate each group, and the results are shown as the mean ± s.e.m., two-tailed paired t-test). G-I. Phenotype switching in HMDMs exposed to the different hypoxic stimulations mentioned in (A-C) was evaluated using flow cytometry. The surface marker CD163 was selected as the M2 polarized macrophage marker. Results are shown from a representative experiment. The numbers in parenthesis represent the percentage of M2 macrophages that was obtained during flow cytometric analysis of macrophages obtained from 3 patients. The data are presented as the mean ± s.e.m.; n=3.
Figure 5
Figure 5. Cytokine secretion and gene expression by HMDMs after hypoxic stimulations
A-D. Human monocytes were stimulated as described in Figure 4B and 4C. On day 7, the macrophages were stimulated for 24 h using LPS+IFN-γ. After 24 h, the concentrations of the cytokines IL-6, TNF-α, IL-10 and CCL-22 were determined in the HMDM culture supernatants. The same procedures was followed for human monocytes that were cultured with U251 cell supernatants. E. Human monocytes were cultured for 7 days with only GM-CSF or M-CSF under normoxic or hypoxic conditions. The cells were then stimulated for another 24 h using LPS and IFN-γ, and the supernatants of the macrophages were subsequently collected to analyze cytokine levels. F and G. Heatmap showing the gene expression of IL-12, IL-23, IL-1b, TGF-β, IL-1ra and CD163 in HMDMs after the cells were stimulated using same conditions described above.
Figure 6
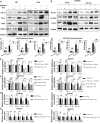
Figure 6. ACF partially reverses M2 macrophage polarization in a HIF-dependent manner
A. Western blot analysis of HIF-1α, TGF-α, TGF-β, and POSTN levels in U87 and U251 cells that were cultured under normoxic or hypoxic conditions for 2 days with or without ACF. B. Human monocytes were cultured in the presence of GM-CSF or M-CSF for 7 days under normoxic or hypoxic conditions and with or without ACF. The HMDMs were then stimulated for 24 h using LPS + IFN-γ. Western blot analysis showing HIF-1α, M-CSFR, and TGF-β levels in the cells shown above. C. The gene expression level of the HIF target Pgk-1 was analyzed in U87/U251 cells and THP-1 macrophage-like cells that were grown under normoxic/hypoxic conditions in the presence of PBS or ACF. D. THP-1-induced macrophages and U87/U251 cells were transfected with a plasmid containing firefly luciferase under the control of the VEGF promoter (with three consecutive HRE sequences) and cultured under normoxic or hypoxic conditions in the presence or absence of ACF. *, P <0.05, **, P <0.01, NS, P>0.05 (n=3, mean ± s.e.m., two-tailed unpaired t test). E. ACF (3 μM) or BLZ945 (670 nM) or DMSO (1 μL/ml) was added to the culture medium of human monocytes, and the cells were then grown under hypoxic conditions with normoxia-treated glioma supernatants (20%) in the presence of GM-CSF for 7 days. On day 7, the macrophages were stimulated for 24 h with LPS + IFN-γ, and cytokine levels were analyzed in the supernatants. F. Human monocytes were cultured for 7 days with GM-CSF under normoxic conditions in the presence of hypoxia-treated glioma cell supernatants (H-U87/251 Sup.), hypoxia-treated glioma cell supernatants + anti-TGF-β antibodies (H-U87/251 Sup. + TGF-β Ab), ACF-pretreated hypoxia-stimulated glioma cell supernatants (ACF & H-U87/251 Sup.) or hypoxia-stimulated glioma cell supernatants + ACF (3 μM) (H-U87/251 Sup. + ACF). The levels of cytokines were then detected in the culture supernatants. G. Human monocytes were cultured for 7 days with GM-CSF in the presence of a hypoxic environment + hypoxia-treated glioma cell supernatants or a hypoxic environment + ACF-pretreated hypoxia-stimulated glioma cell supernatants + ACF (at a final concentration of 3 μM). On day 7, the macrophages were stimulated for 24 h using LPS + IFN-γ. Cytokine levels were then determined. H. Gene expression levels of IL-12, Il-23, IL-1b, IL-1ra, TGF-β and CD163 in HMDMs that were stimulated as described above in the (G) groups. *, P <0.05, **, P <0.01, NS, P>0.05 (n=3 donors, mean ± s.e.m., two-tailed paired t test).
Figure 7
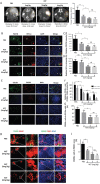
Figure 7. ACF treatment limits glioma progression and M2 type TAM infiltration
A. Representative images of T2-weighted MRI scans of animals in the PBS- or ACF-treated groups at 6 weeks post-injection (in situ) of U87 cells. The line indicates the region of interest that was used to calculate the tumor volume. A graphical analysis of the tumor diameters, as observed in MRI images of the different glioma model groups. *, P <0.05; *, P <0.01; (n=5 tumors, mean ± s.e.m., two-tailed unpaired t test). B. Representative immunofluorescence images of in situ glioma sections that were obtained from animals in different groups of mice and then stained for POSTN (green), HIF-1α (red) and DAPI (blue). C and D. Graphical analysis of POSTN and HIF-1α expression in gliomas that were obtained from animals in the PBS- and ACF-treated groups showing that both POSTN and HIF-1α expression were decreased by treatment with ACF. E. Representative immunofluorescence images of in situ glioma sections that were obtained from different groups of mice and stained for the TAM marker CD11b (green), the M2 macrophage marker CD206 (red) and DAPI (blue). F and G. Graphical analysis of CD11b and CD206 showing that both TAM infiltration and the proportion of M2 type TAMs were lower when the mice were treated with ACF. H. Representative image showing co-localization between CD206 immunofluorescence and pimonidazole (PIMO) staining in the tumor. Scale bars: 200 μm. I. Graphical analysis of (H) showing that there was a decrease in M2 TAM infiltration in hypoxic areas after treatment with ACF. *, P <0.05, **, P <0.01, NS, P >0.05 (n=5 tumors, mean ± s.e.m., one-way ANOVA test).
Figure 8
Figure 8. Schematic representation of the recruitment of TAMs and their M2 polarization in hypoxic glioma areas and a description of a mechanism by which ACF may alter these two processes

References

    1. Ohgaki H. Epidemiology of brain tumors. Methods Mol Biol. 2009;472:323–42. doi: 10.1007/978-1-60327-492-0_14. - DOI - PubMed
    1. Ohgaki H, Kleihues P. Epidemiology and etiology of gliomas. Acta Neuropathol. 2005;109:93–108. - PubMed
    1. Charles NA, Holland EC, Gilbertson R, Glass R, Kettenmann H. The brain tumor microenvironment. Glia. 2012;60:502–14. - PubMed
    1. Gordon S, Taylor PR. Monocyte and macrophage heterogeneity. Nat Rev Immunol. 2005;5:953–64. doi: 10.1038/nri1733. - DOI - PubMed
    1. Chang CI, Liao JC, Kuo L. Macrophage arginase promotes tumor cell growth and suppresses nitric oxide-mediated tumor cytotoxicity. Cancer Res. 2001;61:1100–6. - PubMed

MeSH terms