. 2016 Sep 7;11(9):e0161949.
doi: 10.1371/journal.pone.0161949. eCollection 2016.

Transcriptomic Profiling Analysis of Arabidopsis thaliana Treated with Exogenous Myo-Inositol

Affiliations

Transcriptomic Profiling Analysis of Arabidopsis thaliana Treated with Exogenous Myo-Inositol

Wenxing Ye et al. PLoS One. .

Abstract

Myo-insositol (MI) is a crucial substance in the growth and developmental processes in plants. It is commonly added to the culture medium to promote adventitious shoot development. In our previous work, MI was found in influencing Agrobacterium-mediated transformation. In this report, a high-throughput RNA sequencing technique (RNA-Seq) was used to investigate differently expressed genes in one-month-old Arabidopsis seedling grown on MI free or MI supplemented culture medium. The results showed that 21,288 and 21,299 genes were detected with and without MI treatment, respectively. The detected genes included 184 new genes that were not annotated in the Arabidopsis thaliana reference genome. Additionally, 183 differentially expressed genes were identified (DEGs, FDR ≤0.05, log2 FC≥1), including 93 up-regulated genes and 90 down-regulated genes. The DEGs were involved in multiple pathways, such as cell wall biosynthesis, biotic and abiotic stress response, chromosome modification, and substrate transportation. Some significantly differently expressed genes provided us with valuable information for exploring the functions of exogenous MI. RNA-Seq results showed that exogenous MI could alter gene expression and signaling transduction in plant cells. These results provided a systematic understanding of the functions of exogenous MI in detail and provided a foundation for future studies.


Conflict of interest statement

The authors have declared that no competing interests exist.

Figures
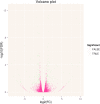
Fig 1
Fig 1. Volcano plot of RNA-Seq data.
A volcano plot is a scatter plot that is often used when analyzing micro-array data sets to provide an overview of interesting genes. The log2 (FC) (fold change) is plotted on the x-axis, and the negative log10 (FDR) (p-value) is plotted on the y-axis. The red point shows no differential gene expression with the absolute value of log2 (FC) less than 1 (FC = 2) and FDR no less than 0.05. The blue point show differentially expressed genes with the absolute value of log2 (FC) no less than 1 (FC = 2) and FDR less than 0.05.
Fig 2
Fig 2. Hierarchical cluster analyses of gene expression based on log ratio RPKM data.
The cluster display expression patterns for a subset of DEGs in two comparisons (A1-vs-A2) between two treatments. The color key represents RPKM normalized log10 transformed counts. Red represents high expression, green represents a low expression. Each column represents an experimental condition, and each row represents a gene. The columns are evenly divided into three groups, I, II and III. Each group contains 61 genes, their order are arranged in accordance with the blue arrow direction. The green box contains 26 genes, which represented the green rows in III group.
Fig 3
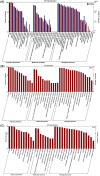
Fig 3. GO classifications of genes.
The results are summarized in three main categories: biological processes, molecular functions and cellular components by GO analysis. (A) GO classifications of all genes between the two treatments and all 177 DEGs between the two treatments. (B) GO analysis of the down-regulated genes in A1-vs-A2. (C) GO analysis of the up-regulated genes in A1-vs-A2.
Fig 4
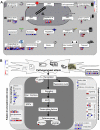
Fig 4. MapMan overview of cellular function (A) and biotic stress (B) showing all DEGs between the two treatments with exogenous myo-inositol.
The big grey circle is an illustrated map of nucleus. The small grey circle indicate annotated biological process (metabolites). The small squares represent individual genes. The color key represents RPKM normalized log2 transformed counts. Red represents up-regulation and blue represents down-regulation between two treatments with exogenous myo-inositol.
Fig 5
Fig 5. qRT–PCR validation of RNA-Seq results.
Fifteen genes were randomly selected from the DEGs (red columns) from the RNA-Seq data and were analyzed for differential expression changes (blue columns) of the genes. The results were the average of two biological replicate samples in triplicate. Error bars indicate the standard error of two biological replicates in qRT–PCR.

Similar articles

Cited by

References

    1. Boss WF, Davis AJ, Im YJ, Galvão RM, Perera IY. Phosphoinositide metabolism: towards an understanding of subcellular signaling. Subcell Biochem. 2006; 39: 181–205. - PubMed
    1. Berridge MJ. Inositol trisphosphate and calcium oscillations. Biochem Soc Symp. 2007; 74: 1–7. - PubMed
    1. Loewus F. Structure and occurrence of inositols in plants In: Morre D J, Boss WF, Loewus FA, editors. Inositol Metabolism in Plants. Wiley-Liss Inc; New York, 1990. pp. 1–11.
    1. Loewus FA, Murthy P. Myo-inositol metabolism in plants. Plant Sci. 2000; 150: 1–19.
    1. Murashige T, Skoog F. A revised medium for rapid growth and bioassays with tobacco tissue culture. Physiol Plant. 1962; 15: 473–497.

MeSH terms

LinkOut - more resources