. 2016 Sep 7;11(9):e0162272.
doi: 10.1371/journal.pone.0162272. eCollection 2016.

The Potential Roles of the G1LEA and G3LEA Proteins in Early Embryo Development and in Response to Low Temperature and High Salinity in Artemia sinica

Affiliations

The Potential Roles of the G1LEA and G3LEA Proteins in Early Embryo Development and in Response to Low Temperature and High Salinity in Artemia sinica

Wei Zhao et al. PLoS One. .

Abstract

Late embryogenesis abundant proteins (LEA) are stress resistance-related proteins that play crucial roles in protecting against desiccation, cold and high salinity in a variety of animals and plants. However, the expression pattern, distribution and functions of LEA proteins in the post-diapause period of Artemia sinica, and under high salinity and low temperature stresses, remain unknown. In this study, the complete cDNA sequences of the group 1 LEA (As-g1lea) and group 3 LEA (As-g3lea) genes from A. sinica were cloned. The expression patterns and location of As-G1LEA and As-G1LEA were investigated. The protein abundances of As-G1LEA, As-G3LEA and Trehalase were analyzed during different developmental stages of the embryo and under low temperature and high salinity stresses in A. sinica. The full-length cDNA of As-g1lea was 960 bp, encoding a 182 amino acid protein, and As-g3lea was 2089 bp, encoding a 364 amino acid protein. As-g1lea and As-g3lea showed their highest expressions at 0 h of embryonic development and both showed higher relative expression in embryonic, rather than adult, development stages. The abundances of As-G1LEA, As-G3LEA and trehalose were upregulated under low temperature and downregulated under high salinity stress. These two genes did not show any tissue or organ specific expression. Our results suggested that these LEA proteins might play a pivotal role in stress tolerance in A. sinica.


Conflict of interest statement

The authors have declared that no competing interests exist.

Figures
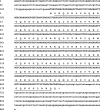
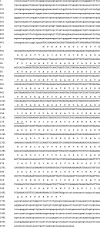
Fig 1
Fig 1. Sequence and structure of As-g1lea.
Sequence analysis of the cDNA and predicted peptide sequences of As-g1lea. Nucleotide and amino acid sequence numbers are shown to the left and the right, respectively. Sequences underlined in black straight lines are the LEA_5 domain.
Fig 2
Fig 2. Sequence and structure of As-g3lea.
Sequence analysis of the cDNA and predicted peptide sequences of As-g3lea. Nucleotide and amino acid sequence numbers are shown to the left and the right, respectively. Sequences underlined in black straight lines are the LEA_4 domain.
Fig 3
Fig 3. Expression of As-g1lea and As-g3lea mRNA at different developmental stages.
The mRNA expression levels of As-g1lea, As-g3lea and gapdh were measured at certain common developmental stages using quantitative real-time PCR, and data are presented as means ± SD of triplicate experiments. The developmental stage of 0 h was set as the control group. Significant differences at different development stages (P< 0.05) were analyzed by one-way analysis of variance (ANOVA) and are indicated by lowercase letters (a, b, c and d).
Fig 4
Fig 4. Relative expression of As-g1lea and As-g3lea mRNA in response to low temperature challenge.
The control group was treated at 30C, and the mRNA expression levels of As-g1lea, As-g3lea and gapdh were measured using quantitative real-time PCR 24 h after being incubated at the indicated temperature. Data are presented as the mean ± SD of triplicate experiments. Highly significant differences between the experimental and control groups are indicated with **P < 0.01, while significant difference are indicated with * 0.01 < P < 0.05.
Fig 5
Fig 5. Relative expression of As-g1lea and As-g3lea mRNA in response to salinity stress.
The 28‰ salinity treatment condition served as a control group, and the mRNA expression levels of As-g1lea, As-g3lea and gapdh were measured using quantitative real-time PCR 24 h after challenge with four different salinity concentrations. Data are presented as the means ± SD of triplicate experiments. Highly significant differences between the experimental and control groups are indicated with **P < 0.01, while significant difference are indicated with * 0.01 < P <0.05.
Fig 6
Fig 6. Prokaryotic expression of the As-G1LEA protein.
(A) Expression analysis of the recombinant As-G1LEA protein. Lane M: Protein markers from 10 to 120 kDa. Lanes 1–4 show the expression of the recombinant As-G1LEA protein from four induction treatments (1 mM IPTG at 37C, 1 mM IPTG at 30C, 0.25 mM IPTG at 37C, and 0.25 mM IPTG at 30C, respectively). Lane 5: Total proteins from non-induced cells. Lane 6: total proteins from induced cells harboring pET-30a (control). (B) Determination of the solubility of the As-G1LEA recombinant protein. Lane 1: Total proteins from non-induced cells. Lane 2: Total As-G1LEA recombinant protein. Lane 4: Soluble fraction of the lysate from induced cells harboring pET-30a-G1LEA. Lane 4: Insoluble fraction of the lysate from induced cells harboring pET-30a-G1LEA. (C) Lane 1: Unpurified, induced As-G1LEA recombinant protein. Lane 2: Flow-through proteins. Lane 3: 20mM imidazole eluate. Lane 4: 40mM imidazole eluate. Lane 5: 60 mM imidazole eluate. (D) Western blot showing specific binding of the antibody to the A. sinica protein.
Fig 7
Fig 7. Prokaryotic expression of the As-G3LEA protein.
(A) Expression analysis of the recombinant As-G3LEA protein. Lane M: Protein markers from 10 to 120 kDa. Lanes 1–4 show the expression of the recombinant As-G3LEA protein from four induction treatments (1 mM IPTG at 37C, 1 mM IPTG at 30C, 0.25 mM IPTG at 37C, and 0.25 mM IPTG at 30C, respectively). Lane 5: Total proteins from non-induced cells. Lane 6: total proteins from induced cells harboring pET-30a (control). (B) Determination of the solubility of the As-G3LEA recombinant protein. Lane 1: Total proteins from non-induced cells. Lane 2: Total As-G3LEA recombinant protein. Lane 4: Soluble fraction of the lysate from induced cells harboring pET-30a-G3LEA. Lane 4: Insoluble fraction of the lysate from induced cells harboring pET-30a-G3LEA. (C) Lane 1: Unpurified, induced As-G3LEA recombinant protein. Lane 2: Flow-through proteins. Lane 3: 10mM imidazole eluate. Lane 4: 20mM imidazole eluate. Lane 5: 40mM imidazole eluate. Lane 6: 60mM imidazole eluate. (D) Western blot showing specific binding of the antibody to the A. sinica protein.
Fig 8
Fig 8. Western blotting analysis of As-G1LEA, As-G3LEA and Trehalase at different developmental stages.
(A) Western blotting analysis of the expression of As-G1LEA, As-G3LEA and Trehalase proteins at different developmental stages in A. sinica. The intensities of the As-G1LEA, As-G3LEA and Trehalase protein bands were normalized against those of GAPDH. (B–D) Values are expressed as arbitrary units of relative value. The expressions of As-G1LEA, As-G3LEA and Trehalase proteins at 0 h were used as the control. Significant differences for the different development stages (P< 0.05) were analyzed by ANOVA and are indicated by lowercase letters (a, b and c).
Fig 9
Fig 9. Western blot analysis of As-G1LEA, As-G3LEA and Trehalase under different temperature challenge.
(A) Western blotting analysis of the expression of As-G1LEA, As-G3LEA and Trehalase proteins at different temperatures in A. sinica. The intensities of the As-G1LEA, As-G3LEA and Trehalase protein bands were normalized against those of GAPDH. (B–D) Values are expressed as arbitrary units of relative value. The expressions of As-G1LEA, As-G3LEA and Trehalase protein at 30C were used as the control. Statistically significant differences are indicated with ** P < 0.01, while * represents 0.01 < P < 0.05.
Fig 10
Fig 10. Western blot analysis of As-G1LEA, As-G3LEA and Trehalase under different salinity stresses.
(A) Western blotting analysis of the expressions of As-G1LEA, As-G3LEA and Trehalase proteins in response to salinity stress in A. sinica. The intensities of the As-G1LEA, As-G3LEA and Trehalase protein bands were normalized against those of GAPDH. (B–D) Values are expressed as arbitrary units of relative value. The expressions of As-G1LEA, As-G3LEA and Trehalase protein at 28‰ salinity were used as the control. Statistically significant differences are indicated with ** P < 0.01, while * represents 0.01 < P < 0.05.
Fig 11
Fig 11. Immunolocalization of As-G1LEA at the Gastrula stage, embryonic stage and pre-adult stage in Artemia sinica.
Paraffin sections of these stages were prepared for immunofluorescence microscopy as described in the experimental procedures. A1, B1 and C1 indicate single-labeling with polyclonal anti-G1LEA; A2, B2 and C2 indicate single-labeling with DAPI (cell nuclear blue fluorescent probe); A3, B3 and C3 represent the image overlay of the samples dual-labeled with polyclonal anti-G1LEA and DAPI. A4, B4 and C4 represent the image overlay of control group samples single-labeled with the secondary antibody. The arrows indicate parts with a positive signal.
Fig 12
Fig 12. Immunolocalization of As-G3LEA at the Gastrula stage, embryonic stage and sub-adult stage in Artemia sinica.
Paraffin sections of these stages were prepared for immunofluorescence microscopy, as described in the experimental procedures. A1, B1 and C1 indicate single-labeling with polyclonal anti-G3LEA; A2, B2 and C2 indicate single-labeled with DAPI (cell nuclear blue fluorescent probe); A3, B3 and C3 represent the image overlay of the samples dual-labeled with polyclonal anti-G3LEA and DAPI. A4, B4 and C4 represent the image overlay of control group samples single-labeled with the secondary antibody. The arrows indicate parts with a positive signal.

Similar articles

Cited by

References

    1. Kuenen DJ, Bass-Becking LGM. Historical notes on Artemia salina. Zoologischer Mededeelingen. 1938;20: 222–230.
    1. Anderson E, Lochhead JH, Lochhead MS, Huebner E. The origin and structure of the tertiary envelope in thick-shelled eggs of the brine shrimp, Artemia. J. Ultrastruct. Res. 1970;32, 497–525. - PubMed
    1. Clegg JS, Trotman CNA. Physiological and biochemical aspects of Artemia ecology. Artemia: Basic and Applied Biology. 2002;1:129–170.
    1. Jiang LJ, Hou L, Zou XY, Zhang RF, Wang J Q, Sun WJ, et al. Cloning and expression analysis of p26 gene in Artemia sinica. Acta Biochim Biophys Sinica. 200739 (5):351–358. - PubMed
    1. Chu B, Yao F, Cheng C, Wu Y, Mei YL, Li XJ, et al. The Potential Role of As-sumo-1 in the Embryonic Diapause Process and Early Embryo Development of Artemia sinica. PloS ONE. 2014;9 (1): e85343, 1–20. 10.1371/journal.pone.0085343 - DOI - PMC - PubMed

MeSH terms