. 2016 Sep 7;11(9):e0161498.
doi: 10.1371/journal.pone.0161498. eCollection 2016.

Detection of Lesions Underlying Intractable Epilepsy on T1-Weighted MRI as an Outlier Detection Problem

Affiliations

Detection of Lesions Underlying Intractable Epilepsy on T1-Weighted MRI as an Outlier Detection Problem

Meriem El Azami et al. PLoS One. .

Abstract

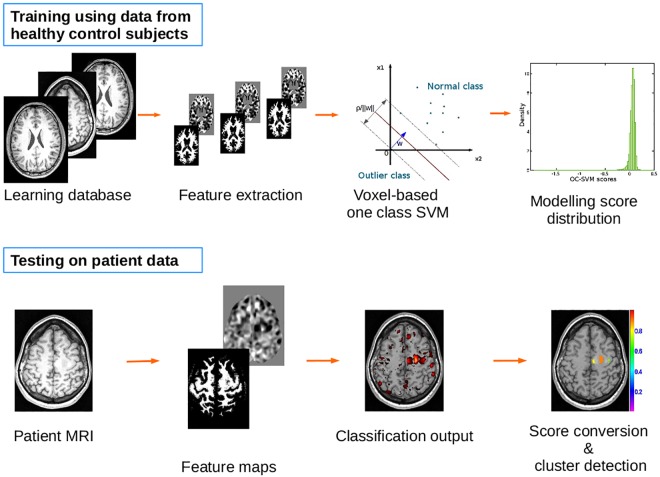
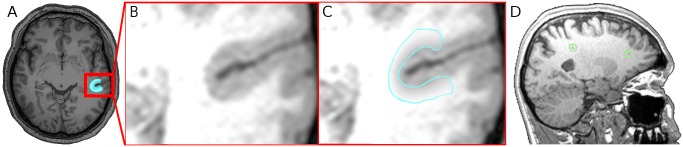
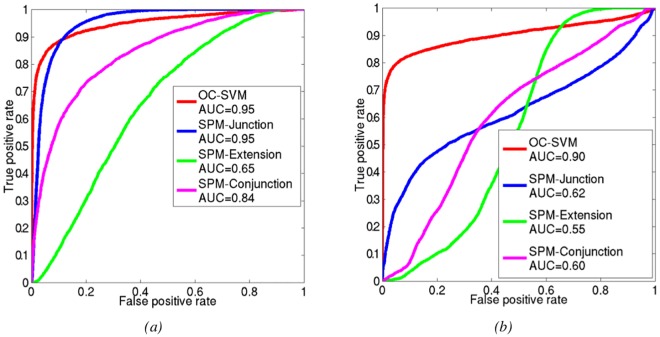
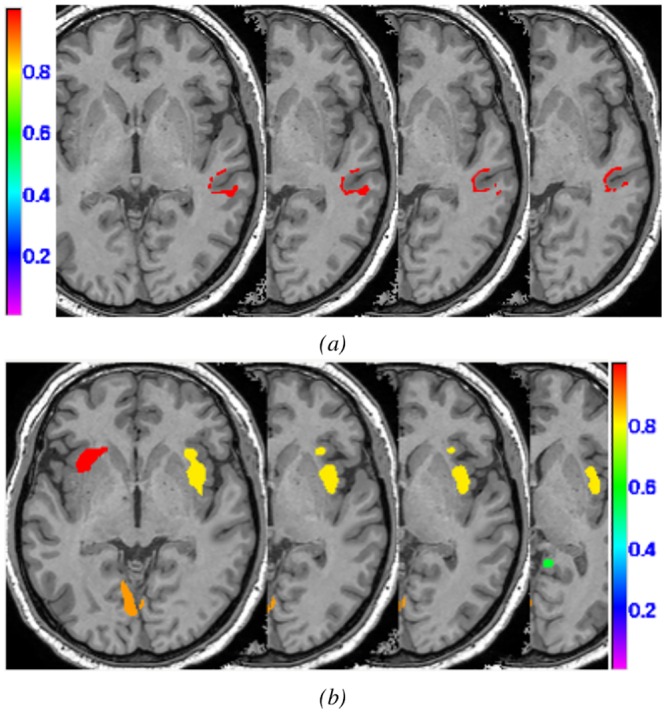
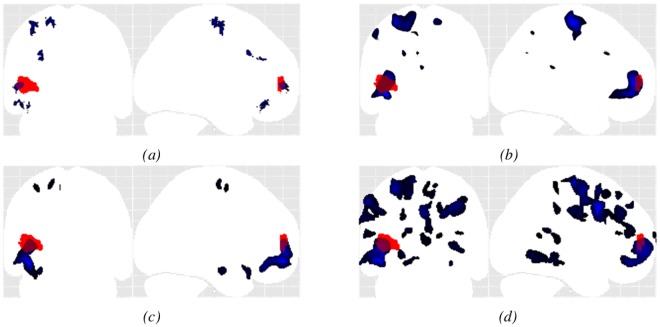
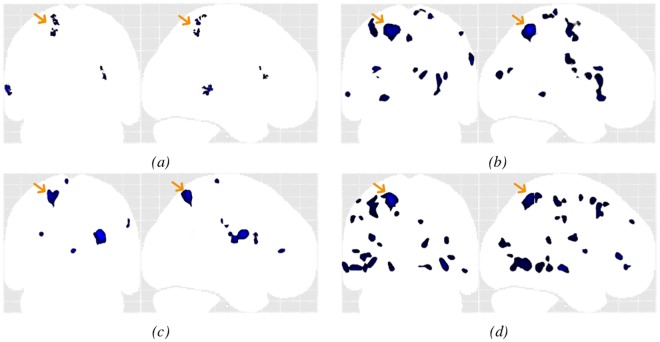
Pattern recognition methods, such as computer aided diagnosis (CAD) systems, can help clinicians in their diagnosis by marking abnormal regions in an image. We propose a machine learning system based on a one-class support vector machine (OC-SVM) classifier for the detection of abnormalities in magnetic resonance images (MRI) applied to patients with intractable epilepsy. The system learns the features associated with healthy control subjects, allowing a voxelwise assessment of the deviation of a test subject pattern from the learned patterns. While any number of various features can be chosen and learned, here we focus on two texture parameters capturing image patterns associated with epileptogenic lesions on T1-weighted brain MRI e.g. heterotopia and blurred junction between the grey and white matter. The CAD output consists of patient specific 3D maps locating clusters of suspicious voxels ranked by size and degree of deviation from control patterns. System performance was evaluated using realistic simulations of challenging detection tasks as well as clinical data of 77 healthy control subjects and of eleven patients (13 lesions). It was compared to that of a mass univariate statistical parametric mapping (SPM) single subject analysis based on the same set of features. For all simulations, OC-SVM yielded significantly higher values of the area under the ROC curve (AUC) and higher sensitivity at low false positive rate. For the clinical data, both OC-SVM and SPM successfully detected 100% of the lesions in the MRI positive cases (3/13). For the MRI negative cases (10/13), OC-SVM detected 7/10 lesions and SPM analysis detected 5/10 lesions. In all experiments, OC-SVM produced fewer false positive detections than SPM. OC-SVM may be a versatile system for unbiased lesion detection.


Conflict of interest statement

The authors have declared that no competing interests exist.

Figures

Fig 1
Fig 1. Example of three different epileptogenic lesions highlighted in red.
A: (patient #4) coronal slice showing a hippocampus anomaly, B: (patient #1) axial slice showing signal and texture change, and C: (patient #2) sagittal slice showing a deep sulcus.
Fig 2
Fig 2. Scheme of the CAD system illustrating the learning (top) and the testing phase (bottom).
Fig 3
Fig 3. Example slice of: (A) GM probability map (B) WM probability map (C) CSF probability map (D) extension map (E) junction map.
Fig 4
Fig 4. Example of OC-SVM score histogram (on a log-scale) obtained for a control subject from NDB1 (blue) overlaid with that of patient #1 (red).
There are differences in a small number of voxels, all with a negative signed distance to the hyperplanes indicating non-normal tissue.
Fig 5
Fig 5. Realistic simulations.
(A) Example slice of the original MRI where the alteration location is highlighted in blue, (B) zoom on the original MRI before introducing the alteration, (C) and zoom on the introduced junction alteration. The introduced lesion has a very low contrast and is almost impossible to detect with the naked eye. (D) Example of a simulation subject sagittal MRI slice showing two heterotopion-like lesions (within the green circles) that were simulated using GM values selected within the range I of grey-level values.
Fig 6
Fig 6. Hyper-parameter optimization curve.
The bigger the width of the RBF kernel, the worse the generalisability due to the risk of under-fitting. Similarly, the smaller the value of ν, the higher the risk of over-fitting (fewer observations may be excluded); for better generalisability and given noise in medical images, the value should not be too small. Here, the pair (ν = 0.03, σ = 4) is therefore the optimal combination.
Fig 7
Fig 7. Comparison of OC-SVM and SPM performance for the simulated blurred junction and heterotopion-like lesions.
Fig 8
Fig 8. Example of OC-SVM and SPM labelled cluster maps for the blurred junction simulation.
Fig 9
Fig 9. Example MIP of the detected cluster maps (blue) for patient #2 (MRI+) overlaid on the MIP of the expert delineated lesion (red).
(a) OC-SVM distance map thresholded at p < 0.001; (b) SPM analysis based on the T-score map from the conjunction of both contrasts thresholded at p < 0.001 (c) SPM junction-based T-score map thresholded at p < 0.001; (d) SPM extension-based T-score map thresholded at p < 0.001.
Fig 10
Fig 10. Example MIP of the detected cluster maps (blue) for patient #10 (MRI-), the presumed lesion is indicated with the yellow arrow.
(a) OC-SVM distance map thresholded at p < 0.001; (b) SPM analysis based on the T-score map from the conjunction of both contrasts thresholded at p < 0.001 (c) SPM junction-based T-score map thresholded at p < 0.001; (d) SPM extension-based T-score map thresholded at p < 0.001.

References

    1. Taylor D, Falconer M, Bruton C, Corsellis J. Focal dysplasia of the cerebral cortex in epilepsy. Journal of Neurol Neurosurg Psychiatry. 1971;34:369–387. 10.1136/jnnp.34.4.369 - DOI - PMC - PubMed
    1. Blümcke I, Thom M, Aronica E, et al. The clinicopathologic spectrum of focal cortical dysplasias: a consensus classification proposed by an ad hoc Task Force of the ILAE Diagnostic Methods Commission. Epilepsia. 2011;52(1):158–74. 10.1111/j.1528-1167.2010.02777.x - DOI - PMC - PubMed
    1. Fauser S, Schulze-Bonhage A, Honegger J, Carmona H, et al. Focal cortical dysplasias: surgical outcome in 67 patients in relation to histological subtypes and dual pathology. Brain: a journal of neurology. 2004;127(Pt 11):2406–18. 10.1093/brain/awh277 - DOI - PubMed
    1. Lerner JT, Salamon N, Hauptman JS, Velasco TR, et al. Assessment and surgical outcomes for mild type I and severe type II cortical dysplasia: a critical review and the UCLA experience. Epilepsia. 2009;50(6):1310–35. 10.1111/j.1528-1167.2008.01998.x - DOI - PubMed
    1. Bernasconi A, Bernasconi N, Bernhardt BC, Schrader D. Advances in MRI for ‘cryptogenic’ epilepsies. Nature reviews Neurology. 2011;7(2):99–108. 10.1038/nrneurol.2010.199 - DOI - PubMed