

Mechanisms Underlying the Pathogenesis of Isolated Impaired Glucose Tolerance in Humans
- PMID: 27603902
- PMCID: PMC5155694
- DOI: 10.1210/jc.2016-1998
Mechanisms Underlying the Pathogenesis of Isolated Impaired Glucose Tolerance in Humans
Abstract
Context: Prediabetes is a heterogeneous disorder classified on the basis of fasting glucose concentrations and 2-hour glucose tolerance.
Objective: We sought to determine the relative contributions of insulin secretion and action to the pathogenesis of isolated impaired glucose tolerance (IGT).
Design: The study consisted of an oral glucose tolerance test and a euglycemic clamp performed in two cohorts matched for anthropometric characteristics and fasting glucose but discordant for glucose tolerance.
Setting: An inpatient clinical research unit at an academic medical center.
Patients or other participants: Twenty-five subjects who had normal fasting glucose (NFG) and normal glucose tolerance (NGT) and 19 NFG/IGT subjects participated in this study.
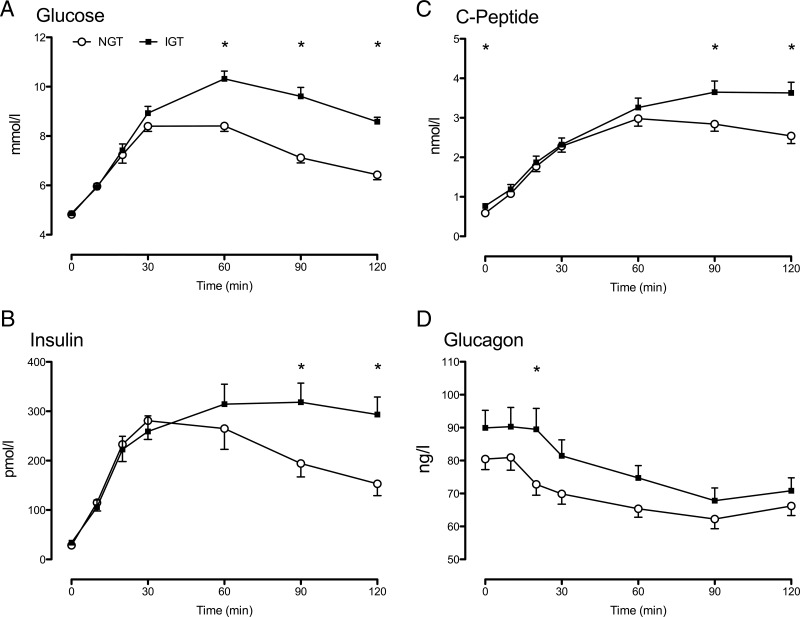
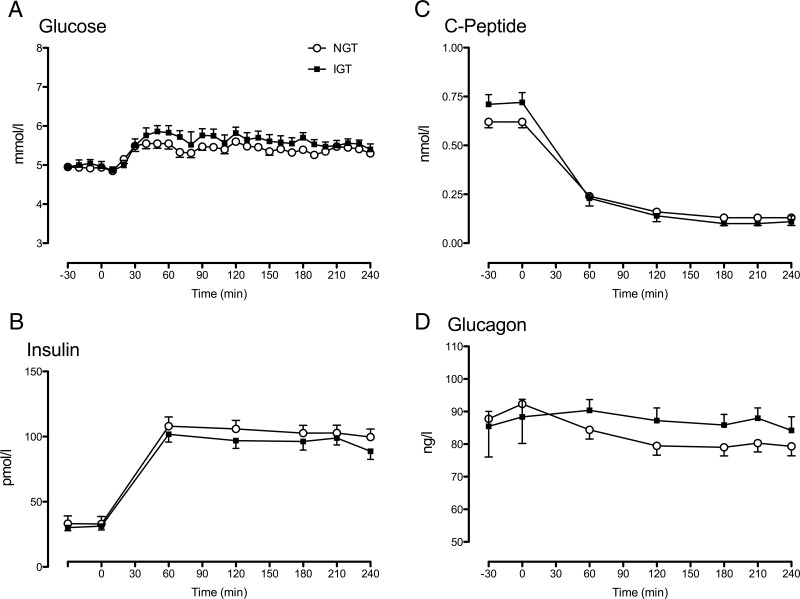
Intervention(s): Subjects underwent a seven-sample oral glucose tolerance test and a 4-hour euglycemic, hyperinsulinemic clamp on separate occasions. Glucose turnover during the clamp was measured using tracers, and endogenous hormone secretion was inhibited by somatostatin.
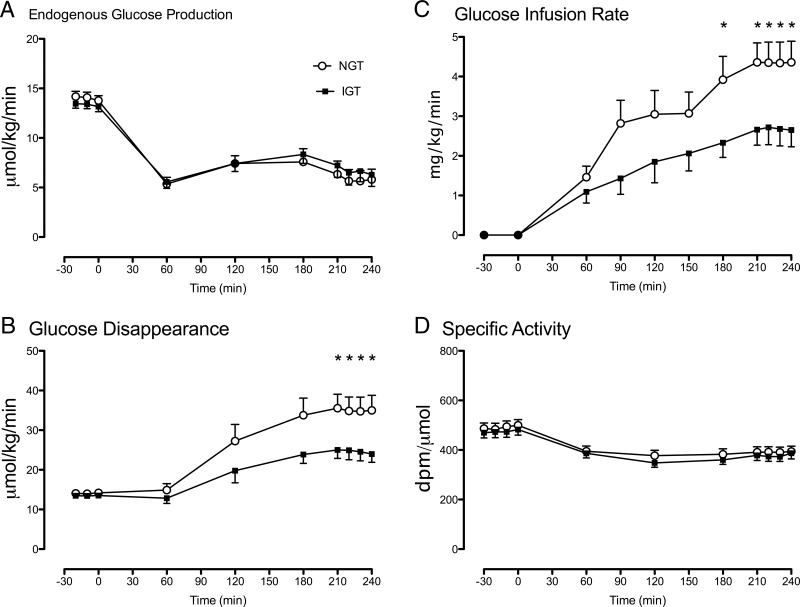
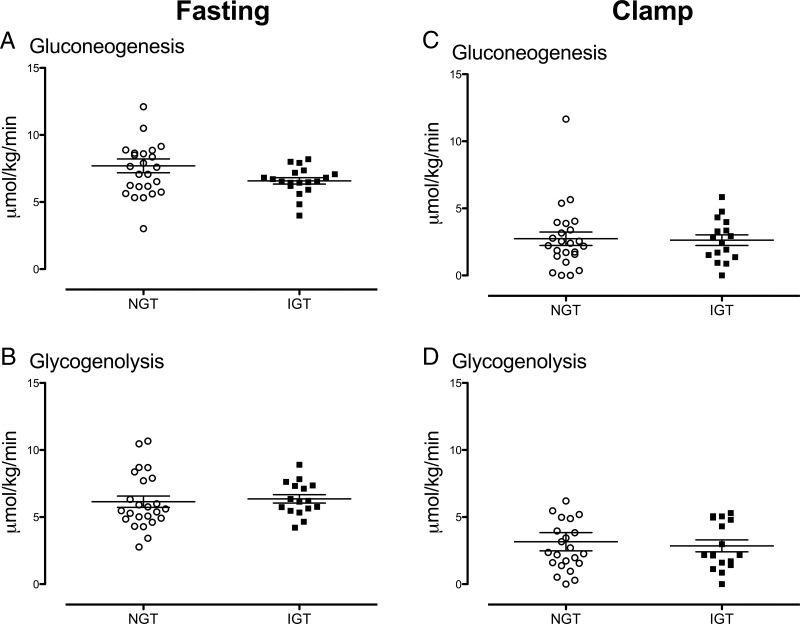
Main outcome measures: We sought to determine whether hepatic glucose metabolism, specifically the contribution of gluconeogenesis to endogenous glucose production, differed between subjects with NFG/NGT and those with NFG/IGT.
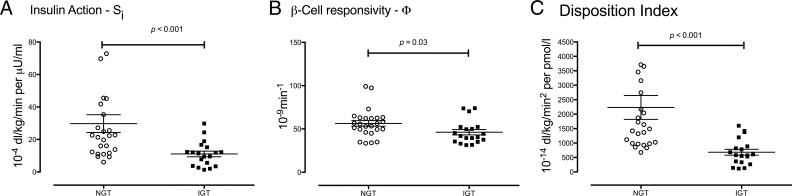
Results: Endogenous glucose production did not differ between groups before or during the clamp. Insulin-stimulated glucose disappearance was lower in NFG/IGT (24.6 ± 2.2 vs 35.0 ± 3.6 μmol/kg/min; P = .03). The disposition index was decreased in NFG/IGT (681 ± 102 vs 2231 ± 413 × 10-14 dL/kg/min2 per pmol/L; P < .001).
Conclusions: We conclude that innate defects in the regulation of glycogenolysis and gluconeogenesis do not contribute to NFG/IGT. However, insulin-stimulated glucose disposal is impaired, exacerbating defects in β-cell function.
Figures
Similar articles
-
Pathogenesis of pre-diabetes: mechanisms of fasting and postprandial hyperglycemia in people with impaired fasting glucose and/or impaired glucose tolerance.Diabetes. 2006 Dec;55(12):3536-49. doi: 10.2337/db06-0319. Diabetes. 2006. PMID: 17130502
-
Pathogenesis of prediabetes: role of the liver in isolated fasting hyperglycemia and combined fasting and postprandial hyperglycemia.J Clin Endocrinol Metab. 2013 Mar;98(3):E409-17. doi: 10.1210/jc.2012-3056. Epub 2013 Jan 23. J Clin Endocrinol Metab. 2013. PMID: 23345093 Free PMC article.
-
Metabolic characteristics of individuals with impaired fasting glucose and/or impaired glucose tolerance.Diabetes. 1999 Nov;48(11):2197-203. doi: 10.2337/diabetes.48.11.2197. Diabetes. 1999. PMID: 10535454
-
Glucoregulatory physiology in subjects with low-normal, high-normal, or impaired fasting glucose.J Clin Endocrinol Metab. 2009 Jun;94(6):2031-6. doi: 10.1210/jc.2008-1348. Epub 2009 Mar 10. J Clin Endocrinol Metab. 2009. PMID: 19276238 Free PMC article.
-
Different mechanisms for impaired fasting glucose and impaired postprandial glucose tolerance in humans.Diabetes Care. 2006 Aug;29(8):1909-14. doi: 10.2337/dc06-0438. Diabetes Care. 2006. PMID: 16873801
Cited by
-
High Serum Zinc Concentration Accelerates Progression of Isolated Impaired Glucose Tolerance to Type 2 Diabetes: A Cohort Study.Biol Trace Elem Res. 2025 Feb 13. doi: 10.1007/s12011-025-04545-w. Online ahead of print. Biol Trace Elem Res. 2025. PMID: 39939554
-
A longitudinal big data approach for precision health.Nat Med. 2019 May;25(5):792-804. doi: 10.1038/s41591-019-0414-6. Epub 2019 May 8. Nat Med. 2019. PMID: 31068711 Free PMC article.
-
Differential contribution of alpha and beta cell dysfunction to impaired fasting glucose and impaired glucose tolerance.Diabetologia. 2023 Jan;66(1):201-212. doi: 10.1007/s00125-022-05794-3. Epub 2022 Sep 16. Diabetologia. 2023. PMID: 36112169 Free PMC article.
-
Insulin in Type 1 and Type 2 Diabetes-Should the Dose of Insulin Before a Meal be Based on Glycemia or Meal Content?Nutrients. 2019 Mar 13;11(3):607. doi: 10.3390/nu11030607. Nutrients. 2019. PMID: 30871141 Free PMC article. Review.
-
Evolution of the diagnostic value of "the sugar of the blood": hitting the sweet spot to identify alterations in glucose dynamics.Physiol Rev. 2023 Jan 1;103(1):7-30. doi: 10.1152/physrev.00015.2022. Epub 2022 May 30. Physiol Rev. 2023. PMID: 35635320 Free PMC article. Review.
References
-
- McCarthy MI. Genomics, type 2 diabetes, and obesity. N Engl J Med. 2010;363:2339–2350. - PubMed
-
- Dinneen SF, Maldonado D, 3rd, Leibson CL, et al. Effects of changing diagnostic criteria on the risk of developing diabetes. Diabetes Care. 1998;21:1408–1413. - PubMed
-
- Meigs JB, Nathan DM, D'Agostino RB, Sr, Wilson PW. Fasting and postchallenge glycemia and cardiovascular disease risk: the Framingham Offspring Study. Diabetes Care. 2002;25:1845–1850. - PubMed
Publication types
MeSH terms
Substances
Grants and funding
LinkOut - more resources
Full Text Sources
Other Literature Sources
Medical
