

High IFN-γ Release and Impaired Capacity of Multi-Cytokine Secretion in IGRA Supernatants Are Associated with Active Tuberculosis
- PMID: 27603919
- PMCID: PMC5014470
- DOI: 10.1371/journal.pone.0162137
High IFN-γ Release and Impaired Capacity of Multi-Cytokine Secretion in IGRA Supernatants Are Associated with Active Tuberculosis
Abstract
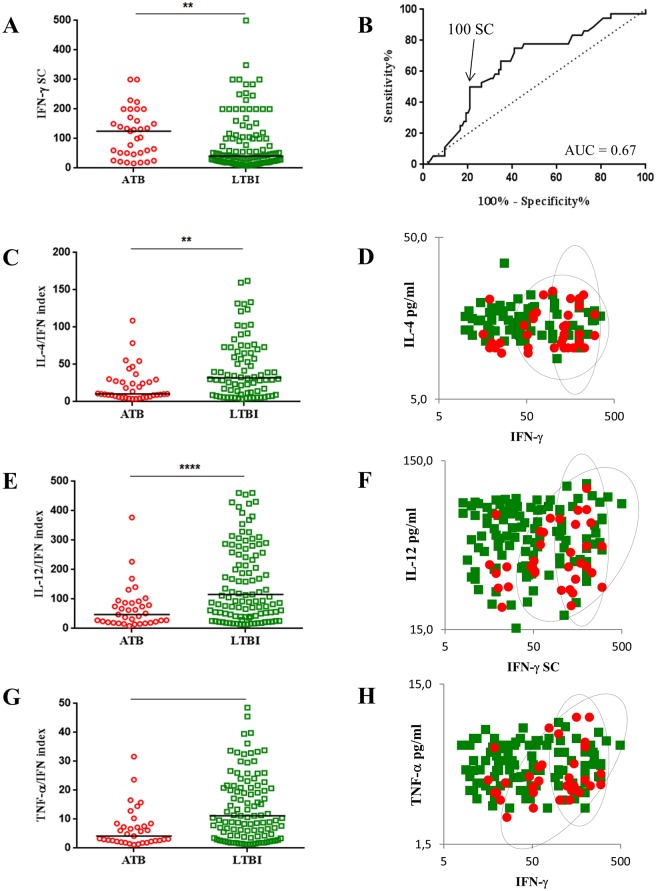
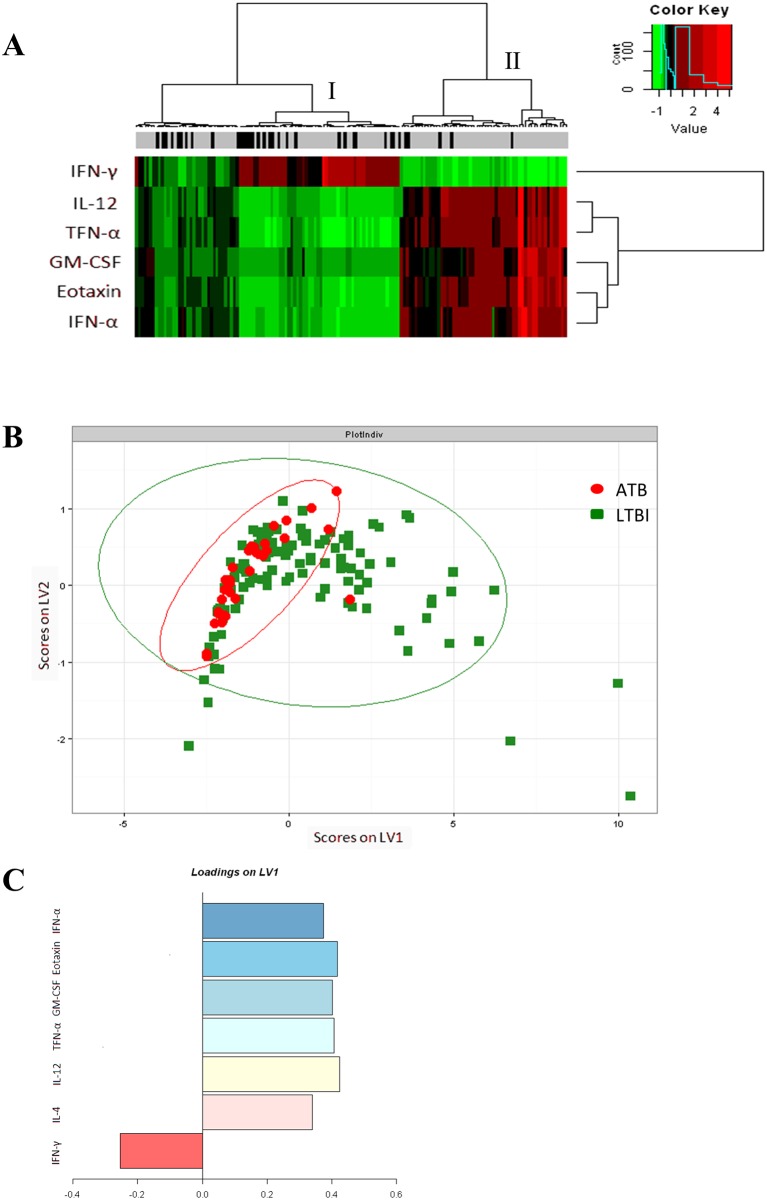
Interferon gamma (IFN-γ) release assays (IGRAs) detect Mycobacterium tuberculosis (Mtb) infection regardless of the active (ATB) or latent (LTBI) forms of tuberculosis (TB). In this study, Mtb-specific T cell response against region of deletion 1 (RD1) antigens were explored by a microbead multiplex assay performed in T-SPOT TB assay (T-SPOT) supernatants from 35 patients with ATB and 115 patients with LTBI. T-SPOT is positive when over 7 IFN-γ secreting cells (SC)/250 000 peripheral blood mononuclear cells (PBMC) are enumerated. However, over 100 IFN-γ SC /250 000 PBMC were more frequently observed in the ATB group compared to the LTBI group. By contrast, lower cytokine concentrations and lower cytokine productions relative to IFN-γ secretion were observed for IL 4, IL-12, TNF-α, GM-CSF, Eotaxin and IFN-α when compared to LTBI. Thus, high IFN-γ release and low cytokine secretions in relation with IFN-γ production appeared as signatures of ATB, corroborating that multicytokine Mtb-specific response against RD1 antigens reflects host capacity to contain TB reactivation. In this way, testing cytokine profile in IGRA supernatants would be helpful to improve ATB screening strategy including immunologic tests.
Conflict of interest statement
The authors have declared that no competing interests exist.
Figures
Similar articles
-
Potential Role for Mycobacterium tuberculosis Specific IL-2 and IFN-γ Responses in Discriminating between Latent Infection and Active Disease after Long-Term Stimulation.PLoS One. 2016 Dec 29;11(12):e0166501. doi: 10.1371/journal.pone.0166501. eCollection 2016. PLoS One. 2016. PMID: 28033330 Free PMC article.
-
[Evolution of IGRA researches].Kekkaku. 2008 Sep;83(9):641-52. Kekkaku. 2008. PMID: 18979999 Review. Japanese.
-
Multiple cytokine responses in discriminating between active tuberculosis and latent tuberculosis infection.Tuberculosis (Edinb). 2017 Jan;102:68-75. doi: 10.1016/j.tube.2016.06.001. Epub 2016 Jun 8. Tuberculosis (Edinb). 2017. PMID: 28061954
-
Involvement of methylated HBHA expressed from Mycobacterium smegmatis in an IFN-γ release assay to aid discrimination between latent infection and active tuberculosis in BCG-vaccinated populations.Eur J Clin Microbiol Infect Dis. 2017 Aug;36(8):1415-1423. doi: 10.1007/s10096-017-2948-1. Epub 2017 Apr 20. Eur J Clin Microbiol Infect Dis. 2017. PMID: 28429162
-
Mycobacterial heparin-binding hemagglutinin (HBHA)-induced interferon-γ release assay (IGRA) for discrimination of latent and active tuberculosis: A systematic review and meta-analysis.PLoS One. 2021 Jul 16;16(7):e0254571. doi: 10.1371/journal.pone.0254571. eCollection 2021. PLoS One. 2021. PMID: 34270559 Free PMC article.
Cited by
-
Combining interferon-γ release assays with lymphocyte enumeration for diagnosis of Mycobacterium tuberculosis infection.J Int Med Res. 2020 Jun;48(6):300060520925660. doi: 10.1177/0300060520925660. J Int Med Res. 2020. PMID: 32527178 Free PMC article.
-
B cells response directed against Cut4 and CFP21 lipolytic enzymes in active and latent tuberculosis infections.PLoS One. 2018 Apr 30;13(4):e0196470. doi: 10.1371/journal.pone.0196470. eCollection 2018. PLoS One. 2018. PMID: 29709002 Free PMC article.
-
QuantiFERON-TB Gold Plus Assay in Patients With Latent vs. Active Tuberculosis in a Low Incidence Setting: Level of IFN-γ, CD4/CD8 Responses, and Release of IL-2, IP-10, and MIG.Front Microbiol. 2022 Apr 8;13:825021. doi: 10.3389/fmicb.2022.825021. eCollection 2022. Front Microbiol. 2022. PMID: 35464936 Free PMC article.
-
Antigen-Specific Intraocular Cytokine Responses Distinguish Ocular Tuberculosis From Undifferentiated Uveitis in Tuberculosis-Immunoreactive Patients.Am J Ophthalmol. 2023 Feb;246:31-41. doi: 10.1016/j.ajo.2022.08.029. Epub 2022 Sep 7. Am J Ophthalmol. 2023. PMID: 36087765 Free PMC article.
References
-
- WHO | Global tuberculosis report 2014. In: WHO [Internet]. [cited 27 May 2015]. Available: http://www.who.int/tb/publications/global_report/en/
-
- Borgström E, Andersen P, Atterfelt F, Julander I, Källenius G, Maeurer M, et al. Immune responses to ESAT-6 and CFP-10 by FASCIA and multiplex technology for diagnosis of M. tuberculosis infection; IP-10 is a promising marker. PloS One. 2012;7: e43438 10.1371/journal.pone.0043438 - DOI - PMC - PubMed
-
- Kim S, Lee H, Kim H, Kim Y, Cho J-E, Jin H, et al. Diagnostic performance of a cytokine and IFN-γ-induced chemokine mRNA assay after Mycobacterium tuberculosis-specific antigen stimulation in whole blood from infected individuals. J Mol Diagn JMD. 2015;17: 90–99. 10.1016/j.jmoldx.2014.08.005 - DOI - PubMed
MeSH terms
Substances
LinkOut - more resources
Full Text Sources
Other Literature Sources
Medical
