. 2016 Sep 7;12(9):e1005095.
doi: 10.1371/journal.pcbi.1005095. eCollection 2016 Sep.

Inhomogeneity Based Characterization of Distribution Patterns on the Plasma Membrane

Affiliations

Inhomogeneity Based Characterization of Distribution Patterns on the Plasma Membrane

Laura Paparelli et al. PLoS Comput Biol. .

Abstract

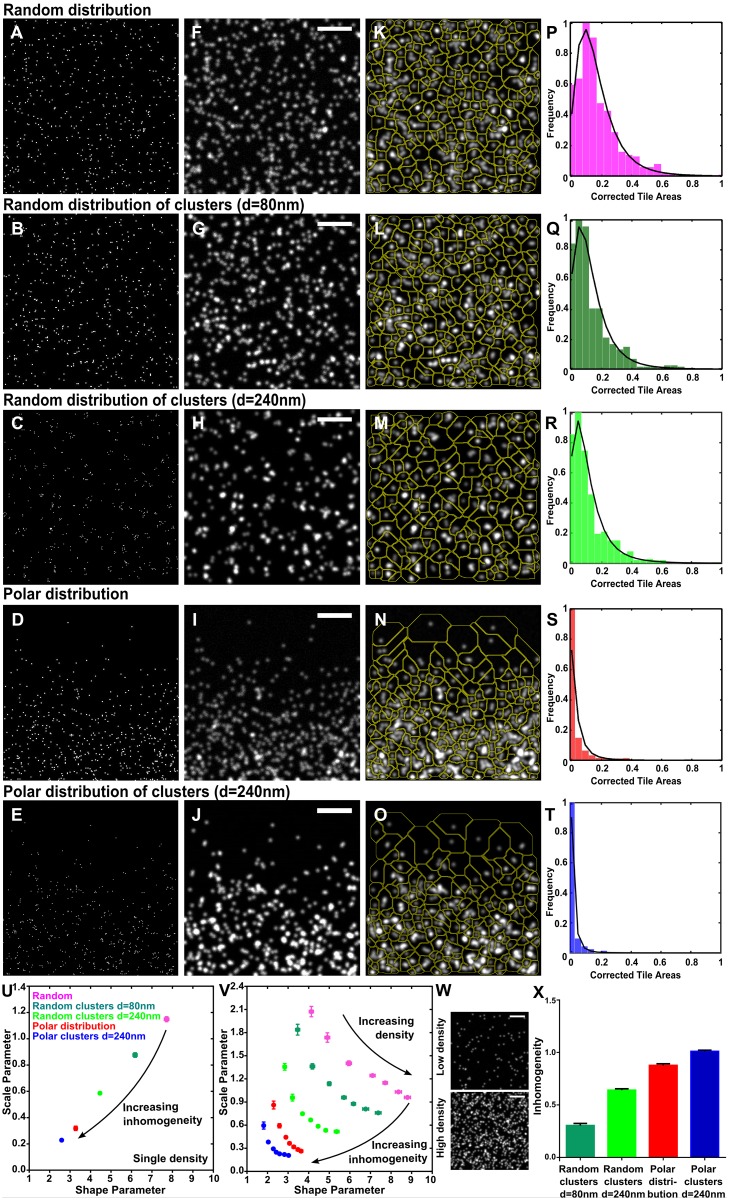
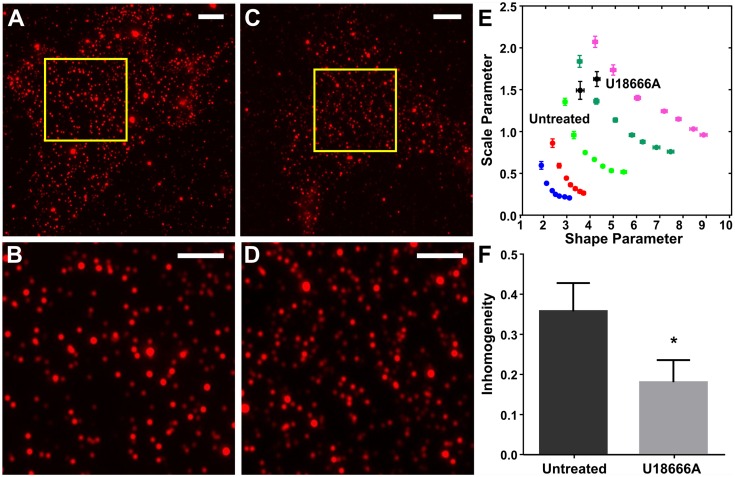
Cell surface protein and lipid molecules are organized in various patterns: randomly, along gradients, or clustered when segregated into discrete micro- and nano-domains. Their distribution is tightly coupled to events such as polarization, endocytosis, and intracellular signaling, but challenging to quantify using traditional techniques. Here we present a novel approach to quantify the distribution of plasma membrane proteins and lipids. This approach describes spatial patterns in degrees of inhomogeneity and incorporates an intensity-based correction to analyze images with a wide range of resolutions; we have termed it Quantitative Analysis of the Spatial distributions in Images using Mosaic segmentation and Dual parameter Optimization in Histograms (QuASIMoDOH). We tested its applicability using simulated microscopy images and images acquired by widefield microscopy, total internal reflection microscopy, structured illumination microscopy, and photoactivated localization microscopy. We validated QuASIMoDOH, successfully quantifying the distribution of protein and lipid molecules detected with several labeling techniques, in different cell model systems. We also used this method to characterize the reorganization of cell surface lipids in response to disrupted endosomal trafficking and to detect dynamic changes in the global and local organization of epidermal growth factor receptors across the cell surface. Our findings demonstrate that QuASIMoDOH can be used to assess protein and lipid patterns, quantifying distribution changes and spatial reorganization at the cell surface. An ImageJ/Fiji plugin of this analysis tool is provided.


Conflict of interest statement

The authors have declared that no competing interests exist.

Figures

Fig 1
Fig 1. QuASIMoDOH analysis steps.
(A) Computer generated image of an arbitrary point pattern. (B) The widefield microscope acquisition process is simulated. Blur by a point spread function and noise are introduced in the image (A) as shown in S1 Fig. (C) Thresholded image (threshold ‘Default’ was selected from the list of ImageJ/Fiji automatic thresholds). (D) Tessellation of the thresholded image; a number has been assigned to each tile. (E) The tile set generated from the binary image in (C) is applied to the grayscale image in (B) for measuring the intensity of the individual tiles. (F) Schematic of the tile area correction. (G) Histogram of tile areas and a curve fitting of the tile area distribution.
Fig 2
Fig 2. Basic principle of QuASIMoDOH analysis of point patterns.
(A-E) Computer generated images of 500 points organized in (A) random distribution, (B) random distribution of clusters with diameter d = 80 nm, (C) random distribution of clusters with diameter d = 240 nm, (D) polarized distribution and (E) polarized distribution of clusters with diameter d = 240 nm. (F-J) Simulation of WF microscopy acquisition process on the point pattern images in (A-E). (K-O) Tessellation of the images in (F-J). (P-T) Histograms of the corrected tile areas fitted with the Inverse Gamma probability density function. (U) Plot of the two parameters from the Inverse Gamma PDF. Each point represents the average (and SEM) of 50 simulated WF images for each pattern, with the same density ρ ~5 (tiles/μm2). (V) Dependency of the shape and scale parameters from the inhomogeneity of the pattern and density. Each point represents the average (and SEM) of 50 simulated WF images for each pattern, with density 1 ≤ ρ ≤7 (tiles/μm2). (W) Two examples of images of random patterns with densities ρ ~1 (tiles/μm2) (top) and ρ ~7 (tiles/μm2) (bottom). (X) Inhomogeneity measure showing increasing inhomogeneity from clusters to polar patterns. Scale bar in (F-J, V): 2 μm.
Fig 3
Fig 3. Detecting protein distributions using widefield microscopy.
(A) Supported plasma membrane sheet of a MEF cell with Na+/K+ ATPase antibody staining. (B) Zoomed in region highlighted by the yellow rectangle in (A). (C) Plasma membrane sheet of a MEF cell exhibiting TfR antibody staining. (D) Zoomed in region highlighted by the yellow rectangle in (C). (E) Green: DiO staining for the MEF cell isolated plasma membrane. Red: Caveolin-1 antibody staining. (F) Zoomed in region highlighted by the yellow rectangle in (E). (G) The comparison with the analysis of simulated images suggests Na+/K+ ATPase was randomly distributed, TfR was organized into clusters, and Cav1 showed a polar distribution of clusters, as expected. (H) The inhomogeneity measure reveals a homogeneous distribution of Na+/K+ ATPase (deviation from random: -0.02) and increasing inhomogeneous organization for TfR (deviation from random: 0.51) and Cav1 (deviation from random: 1.1). Scale bars in (A, C, and E): 5 μm. Scale bars in (B, D, and F): 3 μm. Error bars represent the SEM. Number of analyzed images for Na+/K+ ATPase is 41, TfR is 47, and Cav1 is 50. The average r2 is 0.92, 0.93, and 0.93, respectively.
Fig 4
Fig 4. QuASIMoDOH reveals changes in lipid distribution patterns.
(A) MEF cells stained for the lipid sphingomyelin using Lysenin. Images exhibit a characteristic clustered appearance of spots. (B) Zoomed in region indicated by the yellow rectangle in (A). (C) MEF cells were treated with 3 μg/mL U18666A for 18 h. (D) Zoomed in region indicated by the yellow rectangle in (C). (E-F) Upon drug treatment, the sphingomyelin distribution changes: clusters on the cell membrane appear to be smaller and more homogenous. The inhomogeneity measure reveals a shift to a more homogeneous distribution of Lysenin upon drug treatment (deviation from random significantly shifts from 0.36 to 0.18). Scale bar in (A and C): 5 μm. Scale bar in (B and D): 2 μm. Error bars represent the SEM. Analysis based on 49 cells for both untreated and U18666A treated cells. The average r2 is 0.72 and 0.75 for untreated and drug-treated cells, respectively.
Fig 5
Fig 5. EGFR distribution analysis after EGF stimulation using TIRF imaging.
HeLa cells were stimulated for different lengths of time with 2 ng/mL or 20 ng/mL EGF (t1 = 2 min, t2 = 5 min, t3 = 7 min, t4 = 10 min, t5 = 15 min) at 37°C, then fixed and imaged. (A and B) Distribution of EGFR before stimulation (t0), image acquired in (A) WF and (B) TIRF mode. (C-F) TIRF images acquired after 5 min of stimulation with (C) 2 ng/mL and (D) 20 ng/mL of EGF, and after 10 min of stimulation with (E) 2 ng/mL and (F) 20 ng/mL of EGF. The images show, over the time course of stimulation, that the EGFR becomes more clustered, likely through recruitment to endosomal structures. (G and H) Results from QuASIMoDOH analysis obtained after cell treatment with 2 ng/mL EGF. The time course (G) shows a successive deviation from a random distribution (t0) towards clusters resembling the reference point with a diameter of ~240 nm at t5. The inhomogeneity measure (H) increases with EGF incubation time. After 10 min, the change in the receptor distribution is significant (deviation from random for t0 and consecutive time points: 0.06, 0.05, 0.13, 0.19, 0.37, and 0.60). Results from one-way ANOVA, Dunnett’s multiple comparisons tests for t0 against all consecutive timepoints: p = 0.99, p = 0.75, p = 0.18, p<0.0001, and p<0.0001. (I and J) Results from QuASIMoDOH analysis obtained after treatment with 20 ng/mL EGF. In this case, the internalization rate of change is faster as inhomogeneities that resemble clusters with diameter d = 240 nm are present at the cell surface starting from t4 (I). The inhomogeneity measure (J) shows that the EGFR distribution at t2 is already significantly different from t0 (deviation from random for t0 and consecutive time points: 0.06, 0.17, 0.31, 0.46, 0.58, and 0.68). Results from one-way ANOVA, Dunnett’s multiple comparison test for t0 against all consecutive timepoints: p = 0.17, p = 0.0002, p<0.0001, p<0.0001, and p<0.0001. Scale bar: 5 μm. Error bars represent the SEM. At least 19 images were analyzed per time point. The average r2 in (G) is 0.87, 0.86, 0.86, 0.85, 0.84, and 0.81, for t0, t1, t2, t3, t4, and t5, respectively. The average r2 in (I) is 0.87, 0.86, 0.87, 0.83, 0.80, and 0.78, for t0, t1, t2, t3, t4, and t5, respectively.
Fig 6
Fig 6. Local analysis of the EGFR internalization process.
(A) Simulated image composed of random points (upper half) and clusters (lower half). (B) Example of local area (white tiles) selected by the red circle. (C) Plot of the percentage of tiles correctly detected as random in the upper third of 10 images generated as in (A) (light gray bar) and correctly detected as clusters in the lower third (dark gray bar). Error bars represent the standard deviation. (D) Local analysis of the image in (A) for diameters ranging from 4 to 10 μm and a minimum r2 of 0.45. Tile colors represent the closest reference point, with magenta for random, green for clusters (80 and 240 nm combined), and red representing polarized and polarized clusters (see reference graphs in Fig 2U and 2V). Non-colored areas are tiles with no assigned distribution. (E) EGFR image of a 10 min time point and EGF concentration of 20 ng/mL showing different organizations of EGFR on the surface: dispersed and clustered, potentially the result of localization to endosomal structures (see S10 Fig). (F) Local QuASIMoDOH analysis of (E). Scale bar in (A): 3 μm. Scale bars in (E): 5 μm.

Similar articles

Cited by

References

    1. Lajoie P, Goetz JG, Dennis JW, Nabi IR. Lattices, rafts, and scaffolds: domain regulation of receptor signaling at the plasma membrane. J Cell Biol. 2009;185: 381–385. 10.1083/jcb.200811059 - DOI - PMC - PubMed
    1. Cho W, Stahelin RV. Membrane-Protein Interactions in Cell Signaling and Membrane Trafficking. Annu Rev Biophys Biomol Struct. 2005;34: 119–151. 10.1146/annurev.biophys.33.110502.133337 - DOI - PubMed
    1. Simons K, Gerl MJ. Revitalizing membrane rafts: new tools and insights. Nat Rev Mol Cell Biol. 2010;11: 688–699. 10.1038/nrm2977 - DOI - PubMed
    1. Lingwood D, Simons K. Lipid rafts as a membrane-organizing principle. Science. 2010;327: 46–50. 10.1126/science.1174621 - DOI - PubMed
    1. Yáñez-Mó M, Barreiro O, Gordon-Alonso M, Sala-Valdés M, Sánchez-Madrid F. Tetraspanin-enriched microdomains: a functional unit in cell plasma membranes. Trends Cell Biol. 2009;19: 434–446. 10.1016/j.tcb.2009.06.004 - DOI - PubMed

Publication types

LinkOut - more resources