

Noninvasive assessment of pulmonary arterial capacitance by pulmonary annular motion velocity in children with ventricular septal defect
- PMID: 27604100
- PMCID: PMC5015327
- DOI: 10.1186/s12947-016-0081-4
Noninvasive assessment of pulmonary arterial capacitance by pulmonary annular motion velocity in children with ventricular septal defect
Abstract
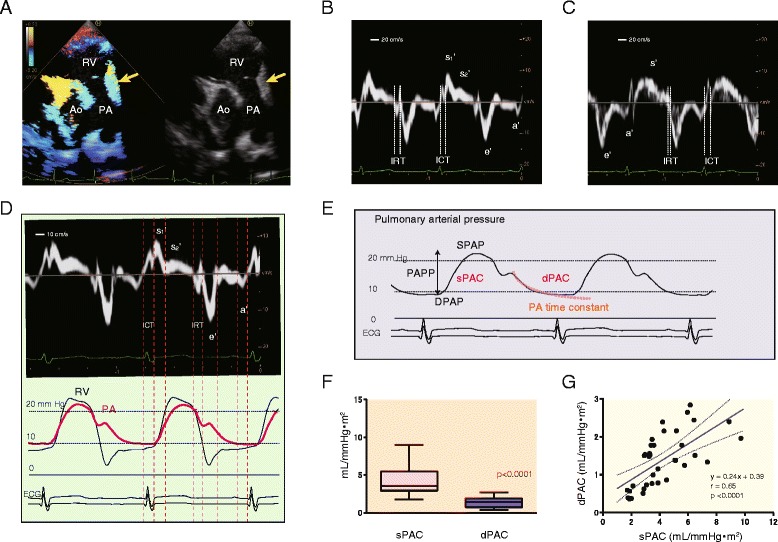
Background: We hypothesized that longitudinal pulmonary arterial deformation during the cardiac cycle reflects pulmonary arterial capacitance. To examine this hypothesis, we assessed whether tissue Doppler-derived pulmonary annular motion could serve as a novel way to evaluate pulmonary arterial capacitance in pediatric patients with ventricular septal defect (VSD).
Methods: In this prospective study, pulmonary annular velocity was measured in children (age, 6 months-5 years) with a preoperative VSD (VSD group, n = 35) and age-matched healthy children (Control group, n = 23). Pulmonary artery capacitance was calculated by two methods. Systolic pulmonary arterial capacitance (sPAC) was expressed as the stroke volume/pulmonary arterial pulse pressure. Diastolic pulmonary arterial capacitance (dPAC) was determined according to a two-element windkessel model of the pulmonary arterial diastolic pressure profile.
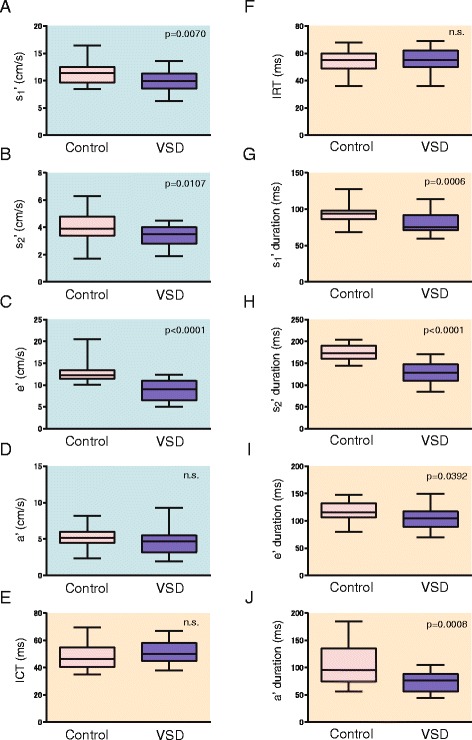
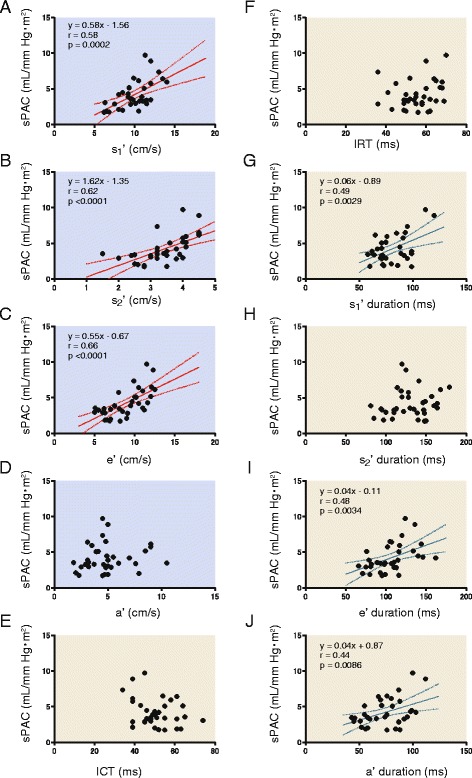
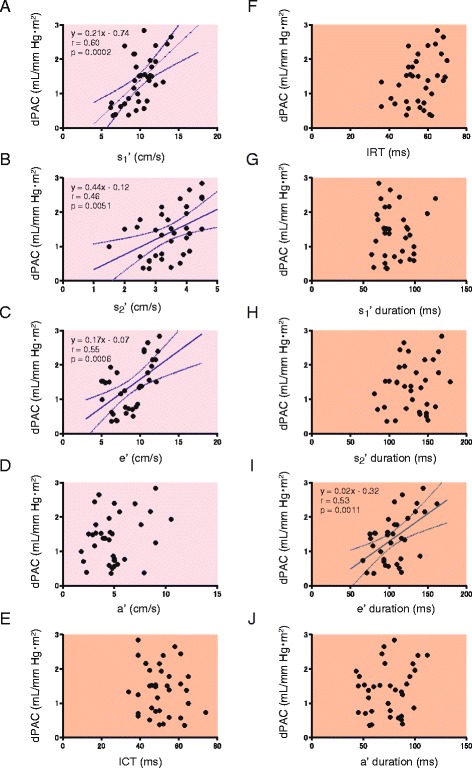
Results: Pulmonary annular velocity waveforms comprised systolic bimodal (s1' and s2') and diastolic e' and a' waves in all participants. The peak velocities of s1', s2', and e' were significantly lower in the VSD group than in the Control group. On multiple regression analysis, sPAC was an independent variable affecting the peak velocities of the s1', s2', and e' waves (β = 0.41, 0.62, and 0.35, respectively). The dPAC affected the s1' wave peak velocity (β = 0.34). The time durations of the s1' and e' waves were independently determined by the sPAC (β = 0.49 and 0.27).
Conclusion: Pulmonary annular motion velocity evaluated using tissue Doppler is a promising method of assessing pulmonary arterial capacitance in children with VSD.
Keywords: Children; Pulmonary annular motion; Pulmonary arterial compliance; Tissue Doppler imaging.
Figures
Similar articles
-
Pulmonary annular motion velocity reflects right ventricular outflow tract function in children with surgically repaired congenital heart disease.Heart Vessels. 2018 Mar;33(3):316-326. doi: 10.1007/s00380-017-1061-9. Epub 2017 Oct 12. Heart Vessels. 2018. PMID: 29026988
-
Pulmonary Annular Motion Velocity Assessed Using Doppler Tissue Imaging - Novel Echocardiographic Evaluation of Right Ventricular Outflow Tract Function.Circ J. 2016;80(1):168-76. doi: 10.1253/circj.CJ-15-0695. Epub 2015 Oct 29. Circ J. 2016. PMID: 26511460 Clinical Trial.
-
Right ventricular diastolic performance in children with pulmonary arterial hypertension associated with congenital heart disease: correlation of echocardiographic parameters with invasive reference standards by high-fidelity micromanometer catheter.Circ Cardiovasc Imaging. 2014 May;7(3):491-501. doi: 10.1161/CIRCIMAGING.113.001071. Epub 2014 Feb 27. Circ Cardiovasc Imaging. 2014. PMID: 24577356
-
Estimation of left ventricular filling pressure with exercise by Doppler echocardiography in patients with normal systolic function: a simultaneous echocardiographic-cardiac catheterization study.J Am Soc Echocardiogr. 2007 May;20(5):477-9. doi: 10.1016/j.echo.2006.10.005. J Am Soc Echocardiogr. 2007. PMID: 17484986
-
Left ventricular torsion abnormalities in patients after the arterial switch operation for transposition of the great arteries with intact ventricular septum.Int J Cardiol. 2013 Oct 12;168(5):4631-7. doi: 10.1016/j.ijcard.2013.07.194. Epub 2013 Jul 29. Int J Cardiol. 2013. PMID: 23953262
References
MeSH terms
LinkOut - more resources
Full Text Sources
Other Literature Sources
