. 2016 Sep 8:6:32952.
doi: 10.1038/srep32952.

NSD2 contributes to oncogenic RAS-driven transcription in lung cancer cells through long-range epigenetic activation

Affiliations

NSD2 contributes to oncogenic RAS-driven transcription in lung cancer cells through long-range epigenetic activation

Verónica García-Carpizo et al. Sci Rep. .

Abstract

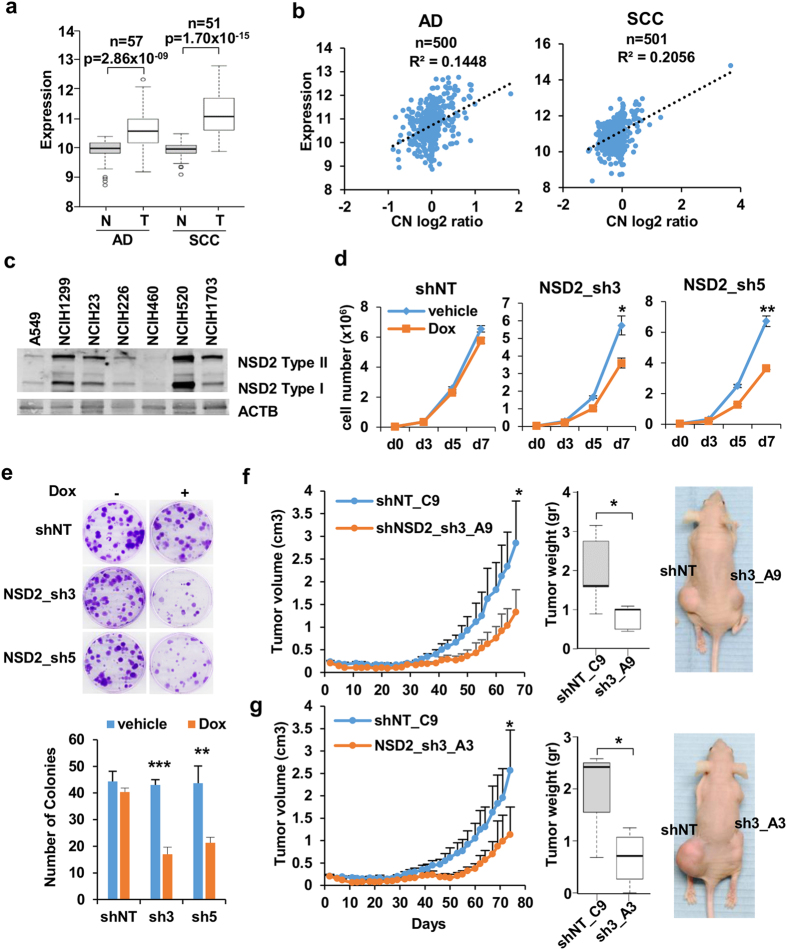
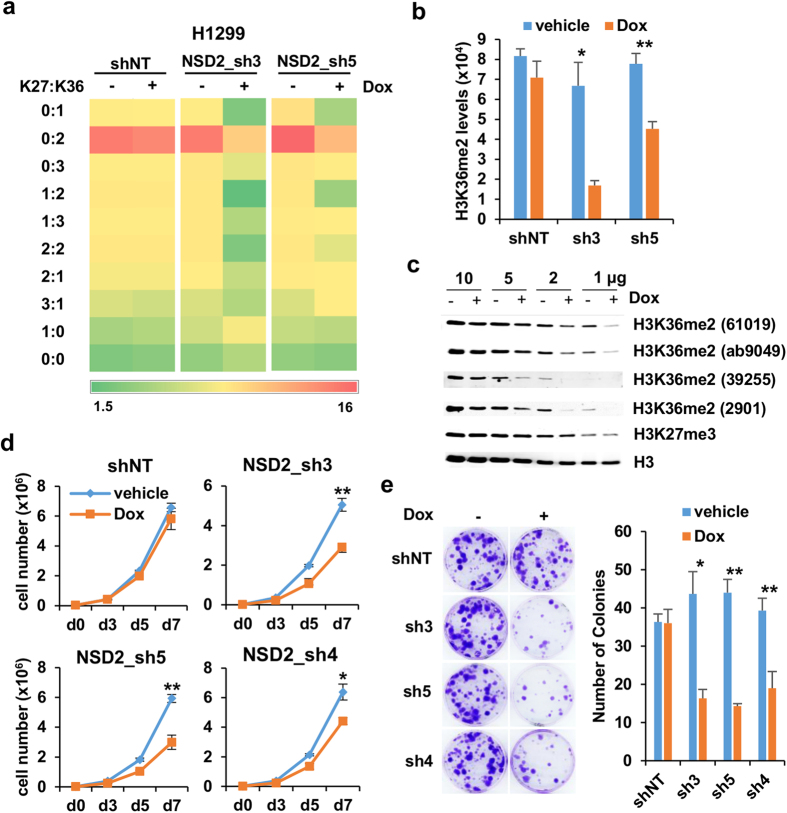
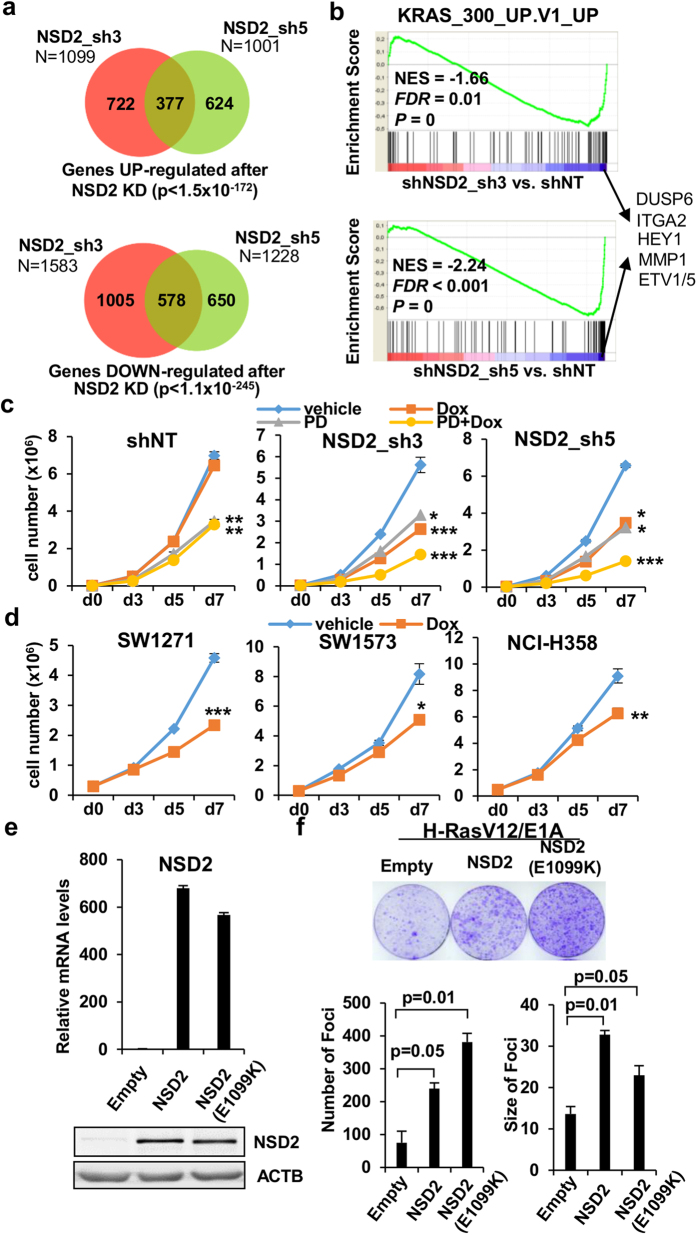
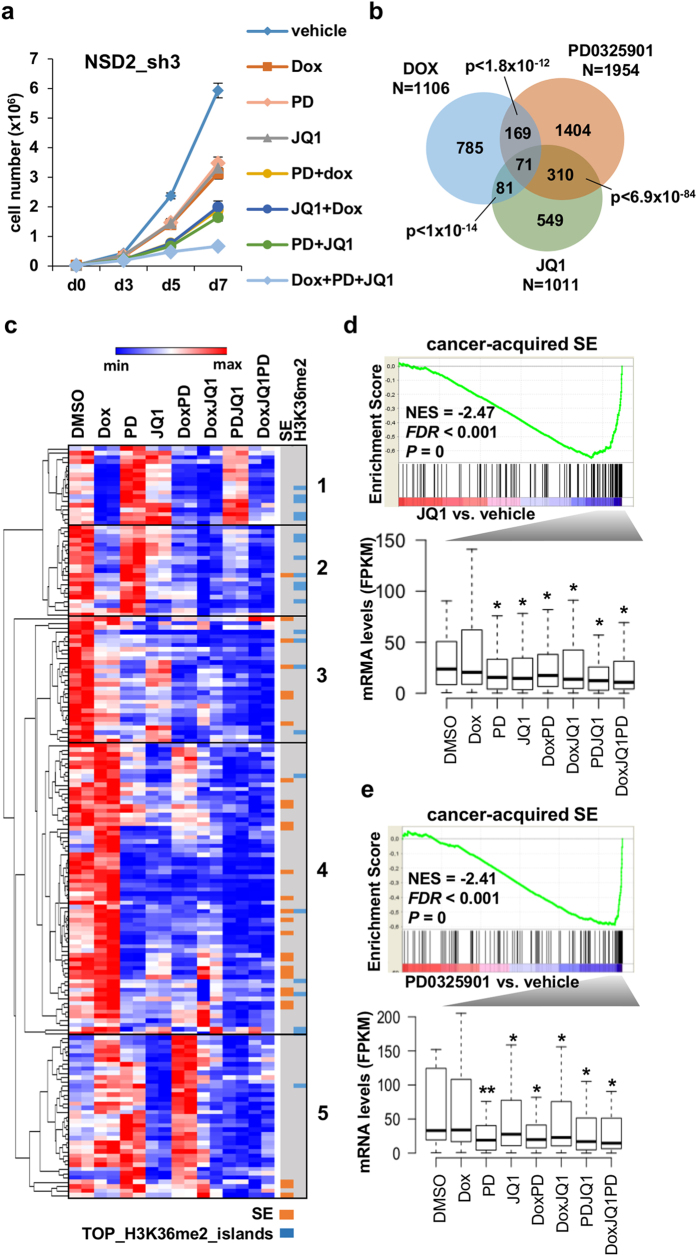
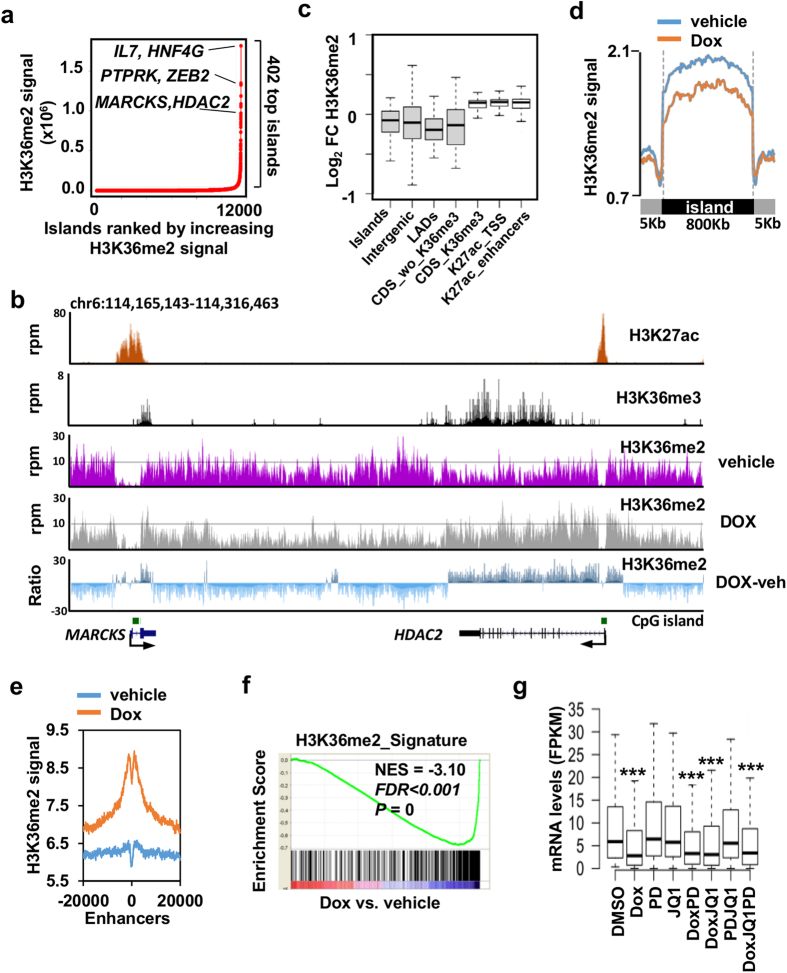
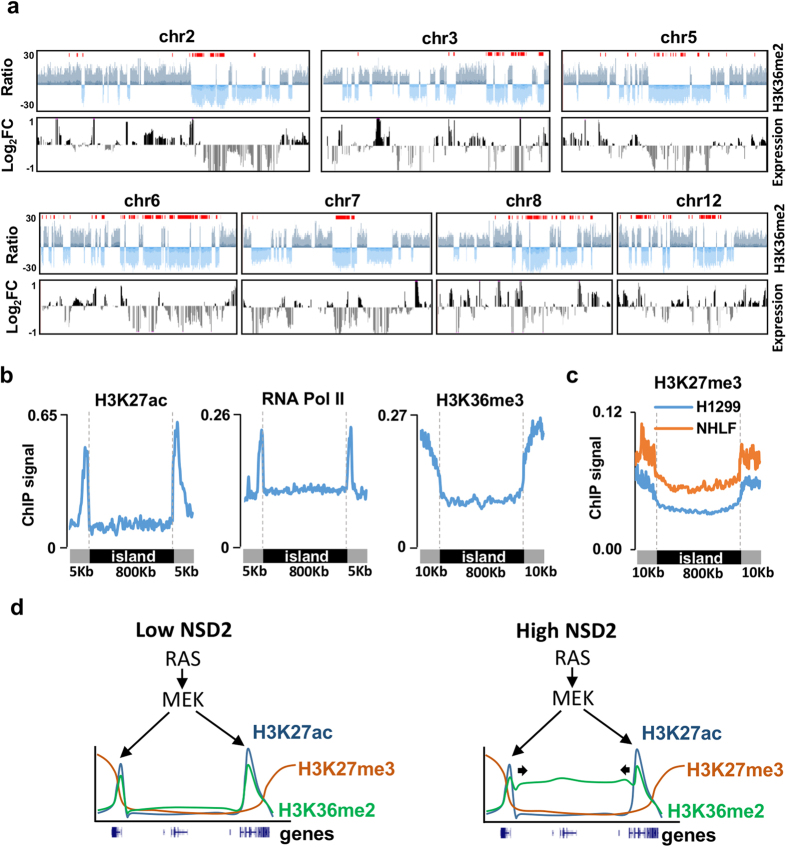
The histone methyltransferase NSD2/WHSC1/MMSET is overexpressed in a number of solid tumors but its contribution to the biology of these tumors is not well understood. Here, we describe that NSD2 contributes to the proliferation of a subset of lung cancer cell lines by supporting oncogenic RAS transcriptional responses. NSD2 knock down combined with MEK or BRD4 inhibitors causes co-operative inhibitory responses on cell growth. However, while MEK and BRD4 inhibitors converge in the downregulation of genes associated with cancer-acquired super-enhancers, NSD2 inhibition affects the expression of clusters of genes embedded in megabase-scale regions marked with H3K36me2 and that contribute to the RAS transcription program. Thus, combinatorial therapies using MEK or BRD4 inhibitors together with NSD2 inhibition are likely to be needed to ensure a more comprehensive inhibition of oncogenic RAS-driven transcription programs in lung cancers with NSD2 overexpression.


Conflict of interest statement

This work was supported by Eli Lilly and Company. B.H., H.B.B. and R.M.C. are employees of Eli Lilly and Company.

Figures

Figure 1
Figure 1. NSD2 is overexpressed in lung cancer and contributes to support the growth of lung cancer cell line H1299.
(a) Box plot of mRNA levels of NSD2 in paired normal (N) and tumor (T) tissues analyzed by RNA-seq by The Cancer Genome Atlas (TCGA) in lung adenocarcinoma (AD) and squamous cell carcinoma (SCC) patients. P-values were calculated using paired t-test. (b) Correlation between copy number (CN) and expression levels in lung cancer samples available from TCGA. (c) Levels of NSD2 determined by western blot in selected lung cancer cell lines. Figure S1 shows mRNA expression and copy number in lung cancer cell lines. (d) Growth curves of H1299 transduced with doxycycline inducible non target shRNA (shNT) and two different shRNAs against NSD2 (sh3 and sh5) in the presence of vehicle or doxycycline. Graph shows mean and standard deviation of triplicates from one representative experiment out of five. *p-value < 0.05 and **p-value < 0.005 determined by t-test. Figure S1 shows validation and location of six different shRNAs. (e) Colony forming assays of cell lines used in D in the presence of vehicle (−) or doxycycline (+). Left panel shows crystal violet staining of colonies. Graph shows mean and standard deviation of colony count in three replicates from one representative experiment out of three. **p-value < 0.005 and ***p-value < 0.0005 determined by t-test. (f ) Xenograft in doxycycline treated nude mice injected with one non target clone of H1299 (shNT_C9) and one NSD2 sh3 clone (NSD2_sh3_A9) in each flank. Left panel shows tumor volume measured at the indicated days after injection and central panel shows tumor weight at the time of sacrifice. Right panel shows one representative animal. Mean and standard deviation from five animals is shown. *p-value < 0.05 determined by paired t-test. Supplementary Fig. 4 shows the characterization of the selected clones. (g) As in F but comparing one non target clone of H1299 (shNT_C9) and a different NSD2 sh3 clone (NSD2_sh3_A3). Mean and standard deviation from four animals is shown. *p-value < 0.05 determined by paired t-test.
Figure 2
Figure 2. Changes in H3K36 methylation in H1299 after NSD2 knock down.
(a) Heat map of the abundance of histone H3 K27 and K36 methylation as determined by mass spectrometry in transduced H1299 cell lines in the presence of vehicle (−) or doxycycline (+). Co-presence of non-methylated (0), monomethylated (1), dimethylated (2) and trimethylated (3) at the indicated residues is shown. Abundance is uncalibrated signal intensity of the indicated peptide as a percentage among all peptides that contained K27 and K36. Two of the most abundant species, K27:K36_2:0 and_3:0 are not shown. (b) Levels of H3K36me2 were determined in the same samples as in A using AlphaLisa. Mean and standard deviation from triplicates is shown. *p-value < 0.05 and **p-value < 0.005 determined by t-test. (c) Levels of H3K36me2 were determined in H1299 cells transduced with sh3 and treated with vehicle (−) or doxycycline (+) using different antibodies against H3K36me2 (61019 and 39255 from Active Motif, ab9049 from Abcam and 2901 from Cell Signaling) and loading decreasing amounts of total cell extract. Total H3 content was used as a loading control. (d) Growth curves of H1299 transduced with doxycycline inducible non target shRNA (shNT) and two different shRNAs that target both type I and type II NSD2 (sh3 and sh5) and a shRNA that targets NSD2 type II only (sh4) in the presence of vehicle or doxycycline. Graph shows mean and standard deviation of three replicates. *p-value < 0.05 and **p-value < 0.005 determined by t-test. (e) Colony forming assays of cell lines used in D in the presence of vehicle (−) or doxycycline (+). Upper panel shows crystal violet staining of colonies. Graph shows mean and standard deviation of colony count in three replicates from one representative experiment out of two. *p-value < 0.05 and **p-value<0.005 determined by t-test.
Figure 3
Figure 3. NSD2 supports the RAS oncogenic program.
(a) Overlap of genes significantly upregulated (upper panel) or downregulated (lower panel) by NSD2 shRNAs sh3 and sh5 at a FDR < 0.05. P-values for the significance of the overlap of genes affected by the two shRNAs is indicated. (b) Gene set enrichment analysis plot showing significant enrichment of RAS-associated gene signature (using KRAS_300_UP.V1_UP gene set from the Molecular Signature Database) in genes downregulated by the sh3 (upper panel) and sh5 (lower panel). Several genes common to the leading edge of both shRNAs are shown. (c) Growth curves of H1299 transduced with doxycycline inducible non target shRNA (shNT) and two different shRNAs against NSD2 (sh3 and sh5) in the presence of vehicle (DMSO), doxycycline (hereafter labelled as Dox) and/or 10 nM MEK inhibitor PD0325901 (hereafter labelled as PD). Graph shows mean and standard deviation of three replicates from one representative experiment out of two. *p-value < 0.05 and ***p-value < 0.0005 determined by t-test comparing each treatment to vehicle. (d) Growth curves of SW1271, SW1573 and NCI-H358 cells transduced with sh3 in the presence of vehicle and doxycycline. *p-value < 0.05, **p-value < 0.005 and ***p-value < 0.0005 by t-test. (e) Levels of NSD2 mRNA (upper panel) and protein (lower panel) in MEFs infected with empty vector (empty), pMSCV-FLAG-NSD2-Puro (NSD2) or gain of function mutant NSD2 (E1099K) (f) Upper panel shows crystal violet staining of RAS- transformed MEFs infected with empty (empty), wild type NSD2 (NSD2) or mutant NSD2 overexpressing retroviruses (NSD2 E1099K). Lower panel shows the mean and standard deviation of the number and size of foci for each condition. P-values according to t-test are also shown.
Figure 4
Figure 4. Cooperative responses of NSD2 knock down, PD0325901 and JQ1 treatments.
(a) Growth curves of H1299 transduced with doxycycline inducible NSD2 shRNA sh3 in the presence of vehicle (DMSO), doxycycline, 10 nM PD0325901 and/or 75 nM JQ1. Graph shows mean and standard deviation of three replicates from one representative experiment out of two. All treatments had significant effects compared to the vehicle at a p-value < 0.0005 except JQ1 treatment at a p-value < 0.005 as determined by t-test. (b) Overlap of genes significantly downregulated (FDR < 0.05) by the indicated independent treatments compared to the vehicle (DMSO). The total number of downregulated genes by each treatment is also shown. P-values for the significance of the overlap of downregulated genes between two treatments are shown. (c) Clustered heat map of the expression of genes contributing the most to the RAS signature and significantly downregulated (FDR < 0.05) by the independent treatments. Association with super-enhancers and overlap with top H3K36me2 methylated islands is indicated. Main clusters of genes with similar patterns of gene expression are indicated. (d) Upper panel shows gene set enrichment analysis (GSEA) plot showing significant enrichment of cancer-acquired super-enhancers-associated gene signature and genes downregulated by JQ1. Lower panel shows the expression of genes on the leading edge for each treatment. *p-value < 0.05 determined by paired t-test comparing each treatment to the vehicle (DMSO). (e) Upper panel shows gene set enrichment analysis (GSEA) plot showing significant enrichment of cancer-acquired super-enhancers-associated gene signature and genes downregulated by PD0325901. The expression of genes on the leading edge is shown in the lower panel. *p-value < 0.05, **p-value < 0.005 determined by paired t-test comparing each treatment to the vehicle (DMSO).
Figure 5
Figure 5. Loss of H3K36me2 correlates with downregulated genes after NSD2 knock down.
(a) Top H3K36me2 islands in vehicle treated cells identified using ROSE. (b) Gene tracks of H3K36me2 signal in presence (dox) or absence (vehicle) of doxycycline. Ratio of H3K36me2 signal in doxycycline minus vehicle treated cells is also shown (Negative light blue values represent loss of signal caused by doxycycline, positive dark blue values represent remaining signal after doxycycline treatment). H3K36me3, H3K27ac signal and CpG islands are also shown. (c) Log2 of fold change (doxycycline vs. vehicle) of H3K36me2 signal at different genomic features located in top H3K36me2 islands. Significance to the fold change was tested using paired two-tailed t test; P = 8.63 × 10−15 in top H3K36me2 islands (islands), P = 5.68 × 10−34 for intergenic regions (intergenic) P = 1.76 × 10−19 for lamina associated domains (LADs), P = 1.44 × 10−15 for coding regions without H3K36me3 (CDS_wo_K36me3), P = 6.531 × 10−101 for regions marked with H3K27ac located at TSSs (K27ac_TSS), P = 1.70 × 10−155 for H3K27ac marked regions not coincident with TSSs (K27ac_enhancers) and P = 4.81 × 10−09 for coding regions with H3K36me3 (CDS_K36me3). (d) Metagene representation of average H3K36me2 density at top H3K36me2 identified in A in the presence of vehicle or doxycycline. The x axis shows the average size of the top H3K36me2 islands flanked by 5 Kb up and down. See Supplementary Table 4 for comparison of H3K36me2 densities at each island in the presence of vehicle or doxycycline. (e) Average density of H3K36me2 −/+20 Kbs around the center of H3K27 acetylated regions not coincident with TSSs (enhancers) in top H3K36me2 islands in H1299 cells transduced with sh3 and treated with doxycycline (Dox) or vehicle. (f ) Gene set enrichment analysis (GSEA) plot showing significant enrichment of top H3K36me2 islands downregulated by dox-associated gene signature (H3K36me2_Signature; Supplementary Table 3) and genes downregulated by doxycycline. (g) Expression of genes on the leading edge of panel F after different treatments. ***p-value < 0.0005 determined by paired t-test comparing each treatment to control (DMSO).
Figure 6
Figure 6. Chromosomal domains with coordinated loss of H3K36me2 and gene expression.
(a) Smoothed H3K36me2 signal ratio (H3K36me2) and gene expression changes (FPKM) in doxycycline versus vehicle treated cells along chromosomes most enriched in top H3K36me2 islands (shown in red). Regions of retention of H3K36me2 are shown in dark blue and loss in light blue. Upregulated genes are shown in black and downregulated genes in grey. (b) H3K27ac and H3K36me3 levels and RNA Pol II occupancy at top H3K36me2 islands and the indicated flanking sites in H1299. (c) Levels of H3K27me3 at top H3K36me2 islands and flanking sites in H1299 and normal human lung fibroblasts (NHLF). (d) Model of NSD2 action in cell lines with RAS activating mutations. RAS signaling contributes to the establishment of super-enhancers. In the presence of low levels of NSD2, H3K36me2 is confined to enhancer regions. When levels of NSD2 are high the H3K36me2 mark spreads along regions of low H3K27me3 levels and low gene content, increasing the expression of genes located on these areas.

References

    1. Morishita M. & Di Luccio E. Cancers and the NSD family of histone lysine methyltransferases. Biochim. Biophys. Acta - Rev. Cancer 1816, 158–163 (2011). - PubMed
    1. Stec I. et al. WHSC1, a 90 kb SET domain-containing gene, expressed in early development and homologous to a Drosophila dysmorphy gene maps in the Wolf-Hirschhorn syndrome critical region and is fused to IgH in t(4;14) multiple myeloma. Hum. Mol. Genet. 7, 1071–82 (1998). - PubMed
    1. Chesi M. et al. The t(4;14) translocation in myeloma dysregulates both FGFR3 and a novel gene, MMSET, resulting in IgH/MMSET hybrid transcripts. Blood 92, 3025–34 (1998). - PubMed
    1. Jaffe J. D. et al. Global chromatin profiling reveals NSD2 mutations in pediatric acute lymphoblastic leukemia. Nat. Genet. 45, 1386–91 (2013). - PMC - PubMed
    1. Oyer J. A. et al. Point mutation E1099K in MMSET/NSD2 enhances its methyltranferase activity and leads to altered global chromatin methylation in lymphoid malignancies. Leukemia 28, 198–201 (2014). - PMC - PubMed

Publication types

MeSH terms