

Simultaneous spatiotemporal mapping of in situ pH and bacterial activity within an intact 3D microcolony structure
- PMID: 27604325
- PMCID: PMC5015094
- DOI: 10.1038/srep32841
Simultaneous spatiotemporal mapping of in situ pH and bacterial activity within an intact 3D microcolony structure
Abstract
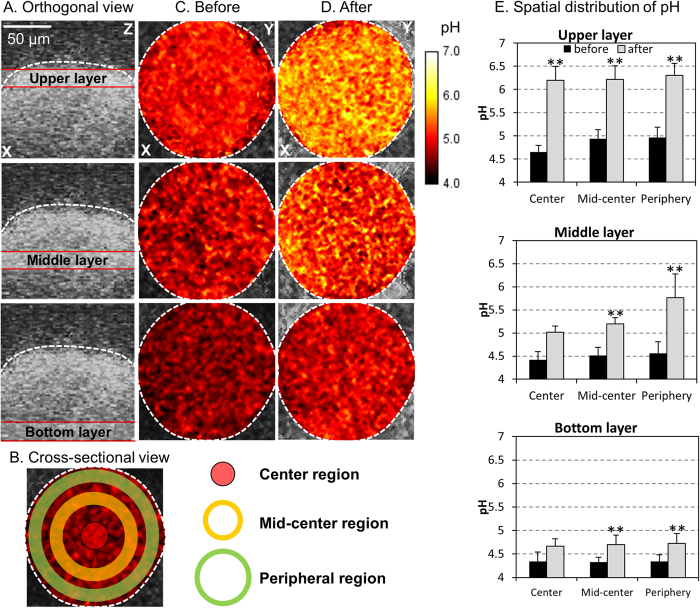
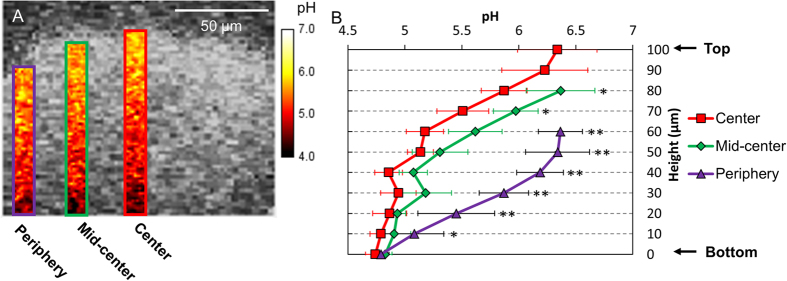
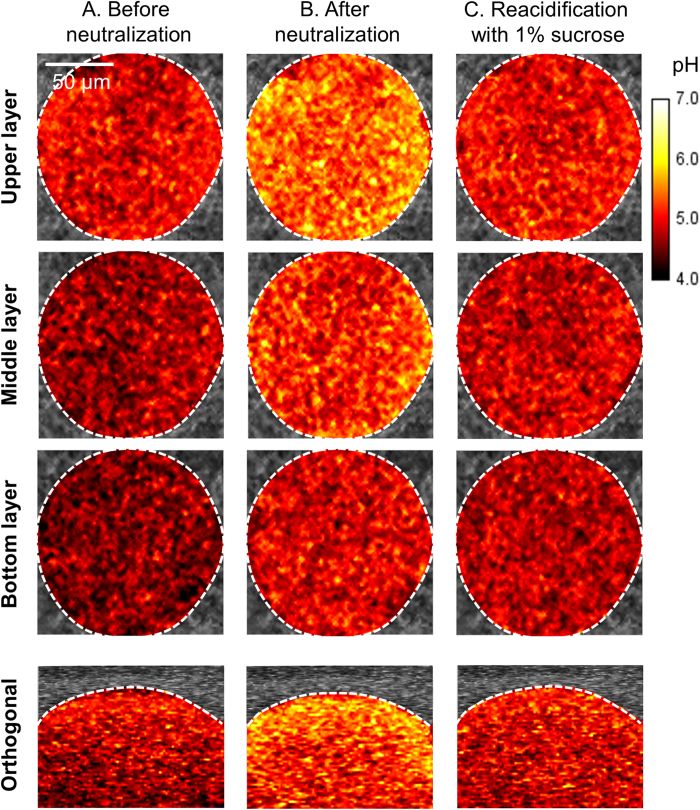
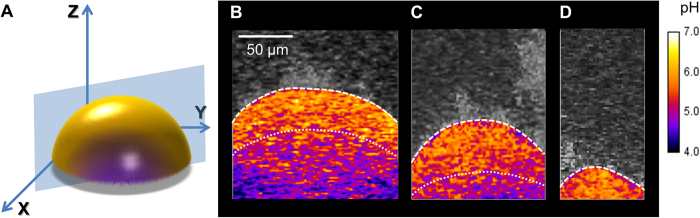
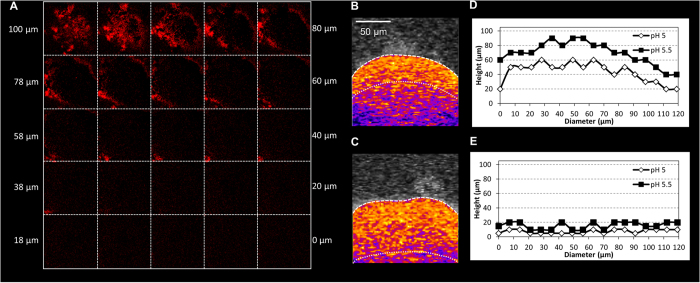
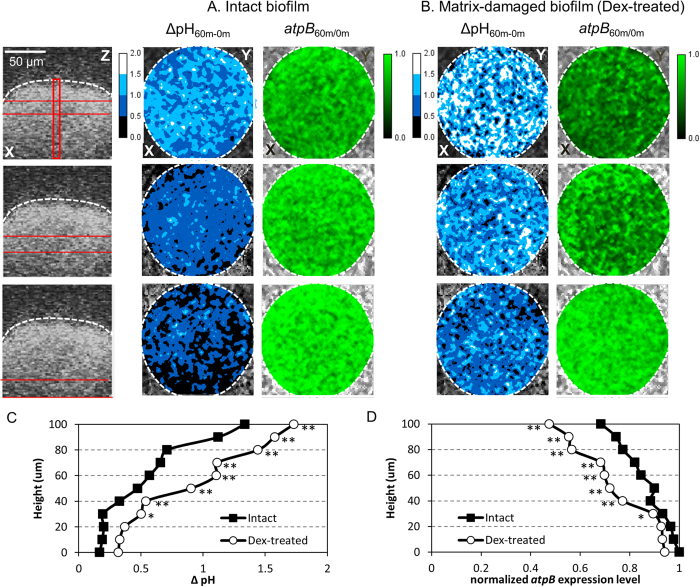
Biofilms are comprised of bacterial-clusters (microcolonies) enmeshed in an extracellular matrix. Streptococcus mutans can produce exopolysaccharides (EPS)-matrix and assemble microcolonies with acidic microenvironments that can cause tooth-decay despite the surrounding neutral-pH found in oral cavity. How the matrix influences the pH and bacterial activity locally remains unclear. Here, we simultaneously analyzed in situ pH and gene expression within intact biofilms and measured the impact of damage to the surrounding EPS-matrix. The spatiotemporal changes of these properties were characterized at a single-microcolony level following incubation in neutral-pH buffer. The middle and bottom-regions as well as inner-section within the microcolony 3D structure were resistant to neutralization (vs. upper and peripheral-region), forming an acidic core. Concomitantly, we used a green fluorescent protein (GFP) reporter to monitor expression of the pH-responsive atpB (PatpB::gfp) by S. mutans within microcolonies. The atpB expression was induced in the acidic core, but sharply decreased at peripheral/upper microcolony regions, congruent with local pH microenvironment. Enzymatic digestion of the surrounding matrix resulted in nearly complete neutralization of microcolony interior and down-regulation of atpB. Altogether, our data reveal that biofilm matrix facilitates formation of an acidic core within microcolonies which in turn activates S. mutans acid-stress response, mediating both the local environment and bacterial activity in situ.
Figures

Similar articles
-
The exopolysaccharide matrix modulates the interaction between 3D architecture and virulence of a mixed-species oral biofilm.PLoS Pathog. 2012;8(4):e1002623. doi: 10.1371/journal.ppat.1002623. Epub 2012 Apr 5. PLoS Pathog. 2012. PMID: 22496649 Free PMC article.
-
Structural organization and dynamics of exopolysaccharide matrix and microcolonies formation by Streptococcus mutans in biofilms.J Appl Microbiol. 2010 Jun;108(6):2103-13. doi: 10.1111/j.1365-2672.2009.04616.x. Epub 2009 Nov 4. J Appl Microbiol. 2010. PMID: 19941630
-
In-situ, time-lapse study of extracellular polymeric substance discharge in Streptococcus mutans biofilm.Colloids Surf B Biointerfaces. 2017 Feb 1;150:98-105. doi: 10.1016/j.colsurfb.2016.11.031. Epub 2016 Nov 24. Colloids Surf B Biointerfaces. 2017. PMID: 27907861
-
Streptococcus mutans-derived extracellular matrix in cariogenic oral biofilms.Front Cell Infect Microbiol. 2015 Feb 13;5:10. doi: 10.3389/fcimb.2015.00010. eCollection 2015. Front Cell Infect Microbiol. 2015. PMID: 25763359 Free PMC article. Review.
-
The exopolysaccharide matrix: a virulence determinant of cariogenic biofilm.J Dent Res. 2013 Dec;92(12):1065-73. doi: 10.1177/0022034513504218. Epub 2013 Sep 17. J Dent Res. 2013. PMID: 24045647 Free PMC article. Review.
Cited by
-
Real-time acid production and extracellular matrix formation in mature biofilms of three Streptococcus mutans strains with special reference to xylitol.Biofilm. 2024 Aug 28;8:100219. doi: 10.1016/j.bioflm.2024.100219. eCollection 2024 Dec. Biofilm. 2024. PMID: 39281714 Free PMC article.
-
Changes in the salivary electrolytic dynamic after sucrose exposure in children with Early Childhood Caries.Sci Rep. 2020 Mar 5;10(1):4146. doi: 10.1038/s41598-020-61128-6. Sci Rep. 2020. PMID: 32139791 Free PMC article.
-
Cariogenic Biofilm: Pathology-Related Phenotypes and Targeted Therapy.Microorganisms. 2021 Jun 16;9(6):1311. doi: 10.3390/microorganisms9061311. Microorganisms. 2021. PMID: 34208588 Free PMC article. Review.
-
Glycan recognition at the saliva - oral microbiome interface.Cell Immunol. 2018 Nov;333:19-33. doi: 10.1016/j.cellimm.2018.08.008. Epub 2018 Aug 18. Cell Immunol. 2018. PMID: 30274839 Free PMC article. Review.
-
The Role of Exopolysaccharides in Oral Biofilms.J Dent Res. 2019 Jul;98(7):739-745. doi: 10.1177/0022034519845001. Epub 2019 Apr 22. J Dent Res. 2019. PMID: 31009580 Free PMC article. Review.
References
-
- Flemming H. & Wingender J. The biofilm matrix. Nat. Rev. Micro. 8, 623–633 (2010). - PubMed
-
- Hall-Stoodley L., Costerton J. W. & Stoodley P. Bacterial biofilms: from the Natural environment to infectious diseases. Nat. Rev. Micro. 2, 95 (2004). - PubMed
-
- Klein M. I., Falsetta M. L., Xiao J., Bowen W. H. & Koo H. The role of extracellular polysaccharides matrix in virulent oral biofilms in Oral Microbial Ecology (Ed. Jakubovics N. S. and Palmer R. J. Jr.) 63–67 (Caister Academic Press, 2013).
Publication types
MeSH terms
Substances
Grants and funding
LinkOut - more resources
Full Text Sources
Other Literature Sources
