. 2016 Sep 7;17(1):184.
doi: 10.1186/s13059-016-1037-6.

An expanded evaluation of protein function prediction methods shows an improvement in accuracy

Yuxiang Jiang  1 Tal Ronnen Oron  2 Wyatt T Clark  3 Asma R Bankapur  4 Daniel D'Andrea  5 Rosalba Lepore  5 Christopher S Funk  6 Indika Kahanda  7 Karin M Verspoor  8   9 Asa Ben-Hur  7 Da Chen Emily Koo  10 Duncan Penfold-Brown  11   12 Dennis Shasha  13 Noah Youngs  12   13   14 Richard Bonneau  13   14   15 Alexandra Lin  16 Sayed M E Sahraeian  17 Pier Luigi Martelli  18 Giuseppe Profiti  18 Rita Casadio  18 Renzhi Cao  19 Zhaolong Zhong  19 Jianlin Cheng  19 Adrian Altenhoff  20   21 Nives Skunca  20   21 Christophe Dessimoz  22   23   24 Tunca Dogan  25 Kai Hakala  26   27 Suwisa Kaewphan  26   27   28 Farrokh Mehryary  26   27 Tapio Salakoski  26   28 Filip Ginter  26 Hai Fang  29 Ben Smithers  29 Matt Oates  29 Julian Gough  29 Petri Törönen  30 Patrik Koskinen  30 Liisa Holm  30   31 Ching-Tai Chen  32 Wen-Lian Hsu  32 Kevin Bryson  22 Domenico Cozzetto  22 Federico Minneci  22 David T Jones  22 Samuel Chapman  33 Dukka Bkc  33 Ishita K Khan  34 Daisuke Kihara  34   35 Dan Ofer  36 Nadav Rappoport  36   37 Amos Stern  36   37 Elena Cibrian-Uhalte  25 Paul Denny  38 Rebecca E Foulger  38 Reija Hieta  25 Duncan Legge  25 Ruth C Lovering  38 Michele Magrane  25 Anna N Melidoni  38 Prudence Mutowo-Meullenet  25 Klemens Pichler  25 Aleksandra Shypitsyna  25 Biao Li  2 Pooya Zakeri  39   40 Sarah ElShal  39   40 Léon-Charles Tranchevent  41   42   43 Sayoni Das  44 Natalie L Dawson  44 David Lee  44 Jonathan G Lees  44 Ian Sillitoe  44 Prajwal Bhat  45 Tamás Nepusz  46 Alfonso E Romero  47 Rajkumar Sasidharan  48 Haixuan Yang  49 Alberto Paccanaro  47 Jesse Gillis  50 Adriana E Sedeño-Cortés  51 Paul Pavlidis  52 Shou Feng  1 Juan M Cejuela  53 Tatyana Goldberg  53 Tobias Hamp  53 Lothar Richter  53 Asaf Salamov  54 Toni Gabaldon  55   56   57 Marina Marcet-Houben  55   56 Fran Supek  56   58   59 Qingtian Gong  60   61 Wei Ning  60   61 Yuanpeng Zhou  60   61 Weidong Tian  60   61 Marco Falda  62 Paolo Fontana  63 Enrico Lavezzo  62 Stefano Toppo  62 Carlo Ferrari  64 Manuel Giollo  64   65 Damiano Piovesan  64 Silvio C E Tosatto  64 Angela Del Pozo  66 José M Fernández  67 Paolo Maietta  68 Alfonso Valencia  68 Michael L Tress  68 Alfredo Benso  69 Stefano Di Carlo  69 Gianfranco Politano  69 Alessandro Savino  69 Hafeez Ur Rehman  70 Matteo Re  71 Marco Mesiti  71 Giorgio Valentini  71 Joachim W Bargsten  72 Aalt D J van Dijk  72   73 Branislava Gemovic  74 Sanja Glisic  74 Vladmir Perovic  74 Veljko Veljkovic  74 Nevena Veljkovic  74 Danillo C Almeida-E-Silva  75 Ricardo Z N Vencio  75 Malvika Sharan  76 Jörg Vogel  76 Lakesh Kansakar  77 Shanshan Zhang  77 Slobodan Vucetic  77 Zheng Wang  78 Michael J E Sternberg  79 Mark N Wass  80 Rachael P Huntley  25 Maria J Martin  25 Claire O'Donovan  25 Peter N Robinson  81 Yves Moreau  82 Anna Tramontano  5 Patricia C Babbitt  83 Steven E Brenner  17 Michal Linial  84 Christine A Orengo  44 Burkhard Rost  53 Casey S Greene  85 Sean D Mooney  86 Iddo Friedberg  87   88 Predrag Radivojac  89
Affiliations

An expanded evaluation of protein function prediction methods shows an improvement in accuracy

Yuxiang Jiang et al. Genome Biol. .

Abstract

Background: A major bottleneck in our understanding of the molecular underpinnings of life is the assignment of function to proteins. While molecular experiments provide the most reliable annotation of proteins, their relatively low throughput and restricted purview have led to an increasing role for computational function prediction. However, assessing methods for protein function prediction and tracking progress in the field remain challenging.

Results: We conducted the second critical assessment of functional annotation (CAFA), a timed challenge to assess computational methods that automatically assign protein function. We evaluated 126 methods from 56 research groups for their ability to predict biological functions using Gene Ontology and gene-disease associations using Human Phenotype Ontology on a set of 3681 proteins from 18 species. CAFA2 featured expanded analysis compared with CAFA1, with regards to data set size, variety, and assessment metrics. To review progress in the field, the analysis compared the best methods from CAFA1 to those of CAFA2.

Conclusions: The top-performing methods in CAFA2 outperformed those from CAFA1. This increased accuracy can be attributed to a combination of the growing number of experimental annotations and improved methods for function prediction. The assessment also revealed that the definition of top-performing algorithms is ontology specific, that different performance metrics can be used to probe the nature of accurate predictions, and the relative diversity of predictions in the biological process and human phenotype ontologies. While there was methodological improvement between CAFA1 and CAFA2, the interpretation of results and usefulness of individual methods remain context-dependent.

Keywords: Disease gene prioritization; Protein function prediction.


Figures

Fig. 1
Fig. 1
Time line for the CAFA2 experiment
Fig. 2
Fig. 2
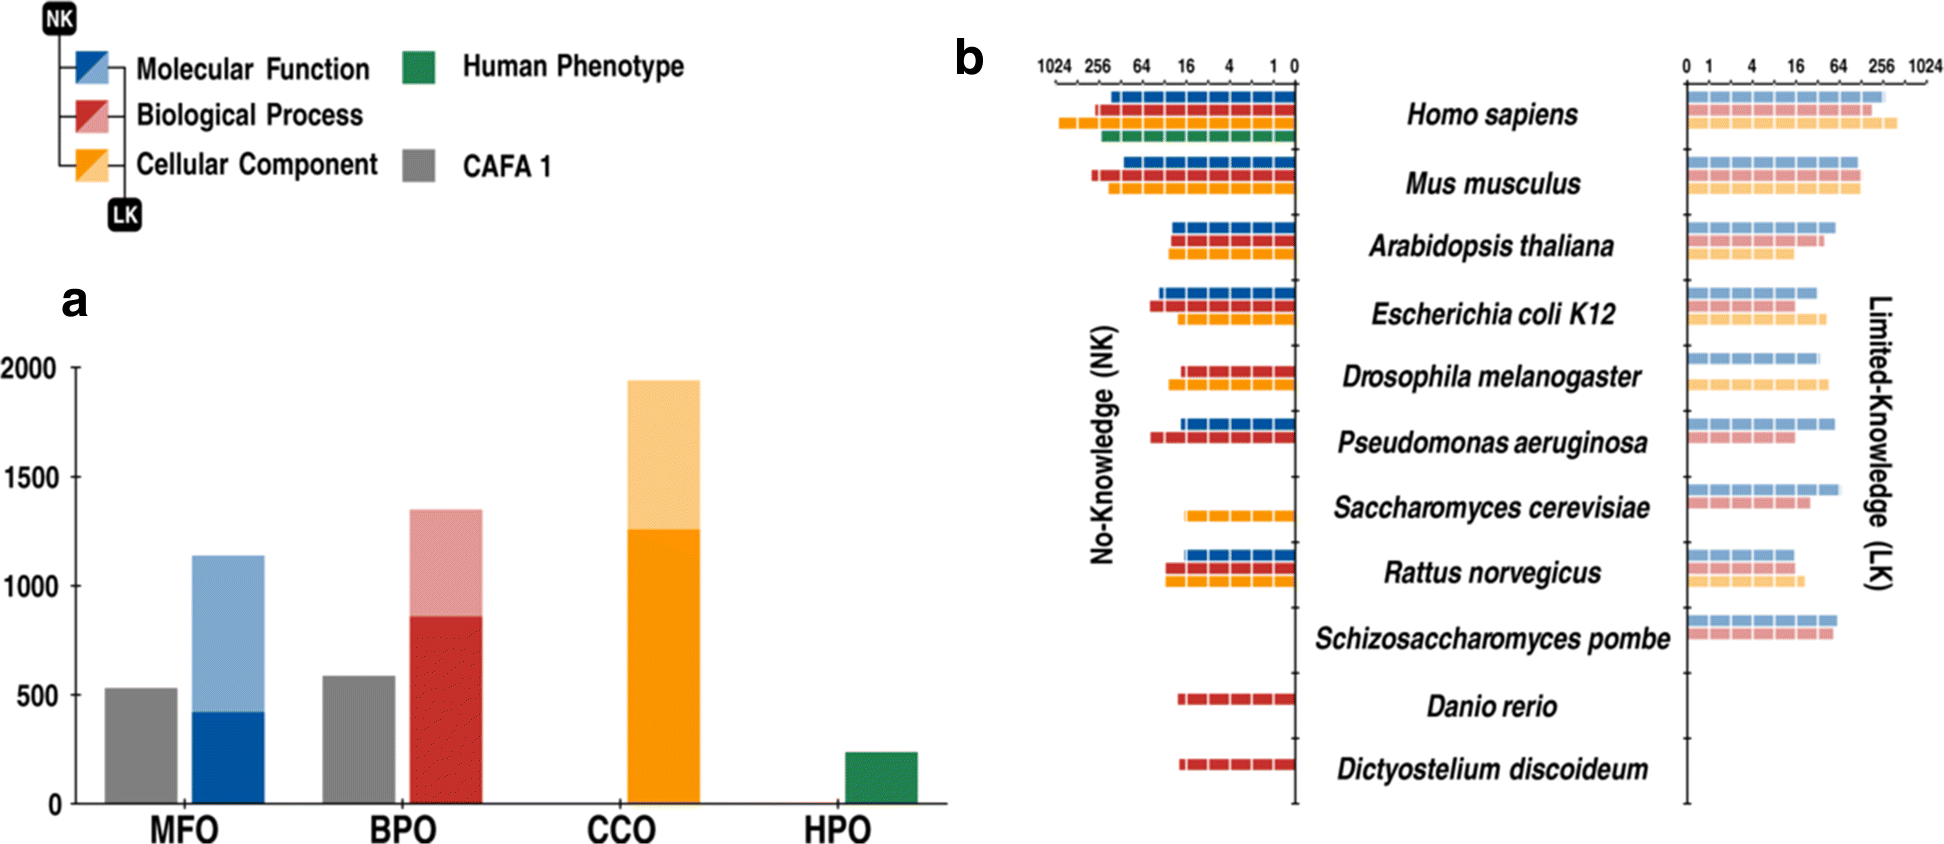
CAFA2 benchmark breakdown. a The benchmark size for each of the four ontologies. b Breakdown of benchmarks for both types over 11 species (with no less than 15 proteins) sorted according to the total number of benchmark proteins. For both panels, dark colors (blue, red, and yellow) correspond to no-knowledge (NK) types, while their light color counterparts correspond to limited-knowledge (LK) types. The distributions of information contents corresponding to the benchmark sets are shown in Additional file 1. The size of CAFA 1 benchmarks are shown in gray. BPO Biological Process Ontology, CCO Cellular Component Ontology, HPO Human Phenotype Ontology, LK limited-knowledge, MFO Molecular Function Ontology, NK no-knowledge
Fig. 3
Fig. 3
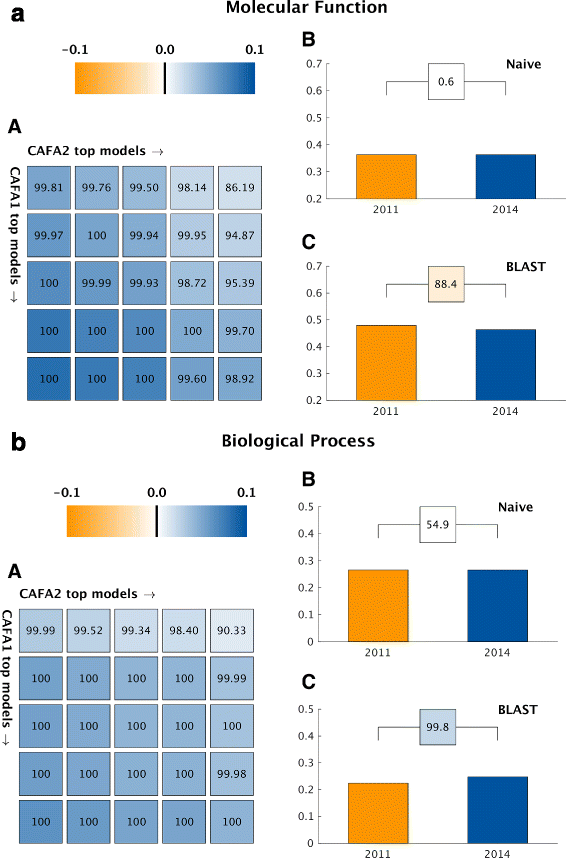
CAFA1 versus CAFA2 (top methods). A comparison in F max between the top-five CAFA1 models against the top-five CAFA2 models. Colored boxes encode the results such that (1) the colors indicate margins of a CAFA2 method over a CAFA1 method in F max and (2) the numbers in the box indicate the percentage of wins. For both the Molecular Function Ontology (a) and Biological Process Ontology (b) results: A CAFA1 top-five models (rows, from top to bottom) against CAFA2 top-five models (columns, from left to right). B Comparison of Naïve baselines trained respectively on SwissProt2011 and SwissProt2014. C Comparison of BLAST baselines trained on SwissProt2011 and SwissProt2014
Fig. 4
Fig. 4
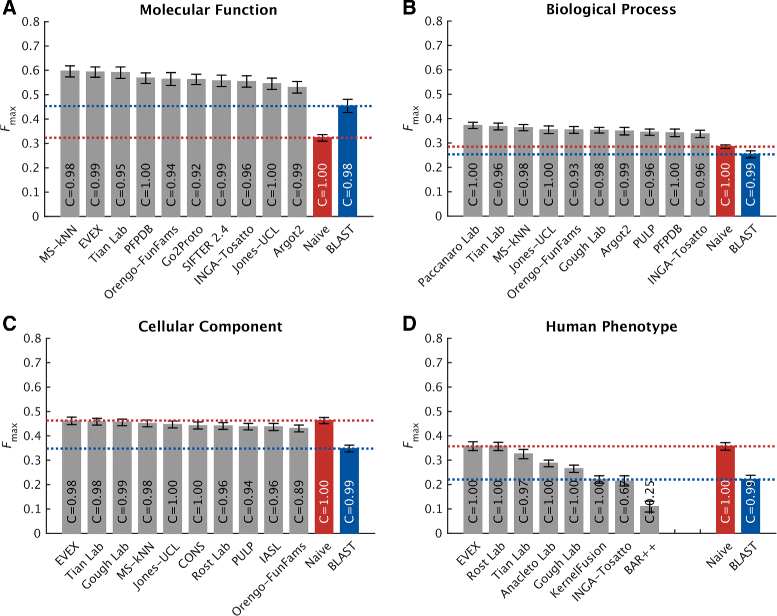
Overall evaluation using the maximum F measure, F max. Evaluation was carried out on no-knowledge benchmark sequences in the full mode. The coverage of each method is shown within its performance bar. A perfect predictor would be characterized with F max=1. Confidence intervals (95 %) were determined using bootstrapping with 10,000 iterations on the set of benchmark sequences. For cases in which a principal investigator participated in multiple teams, the results of only the best-scoring method are presented. Details for all methods are provided in Additional file 1
Fig. 5
Fig. 5
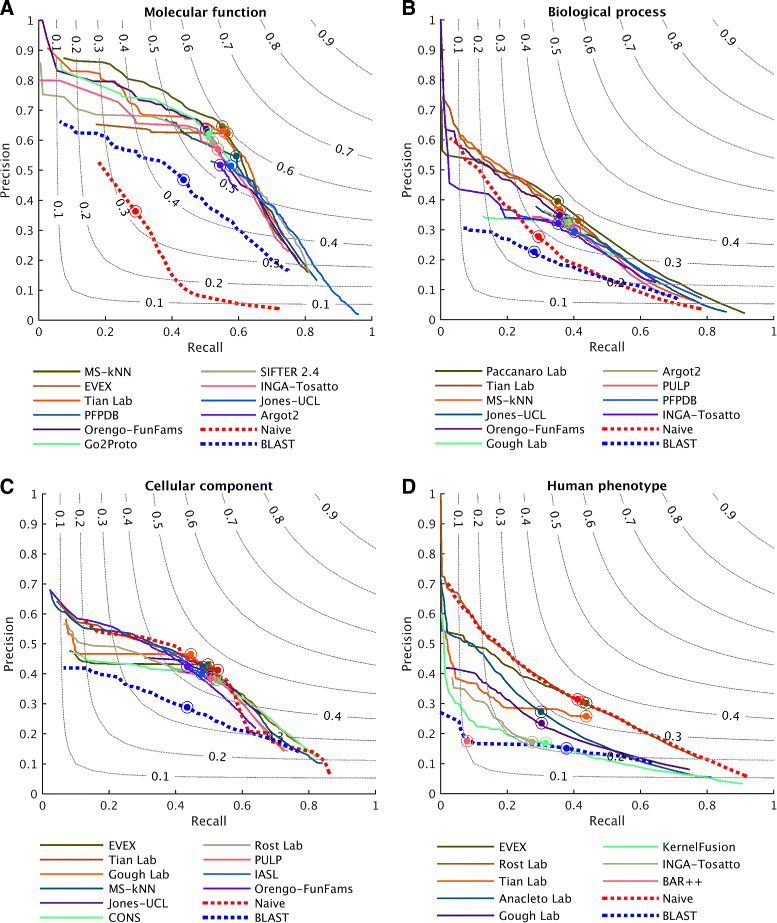
Precision–recall curves for top-performing methods. Evaluation was carried out on no-knowledge benchmark sequences in the full mode. A perfect predictor would be characterized with F max=1, which corresponds to the point (1,1) in the precision–recall plane. For cases in which a principal investigator participated in multiple teams, the results of only the best-scoring method are presented
Fig. 6
Fig. 6
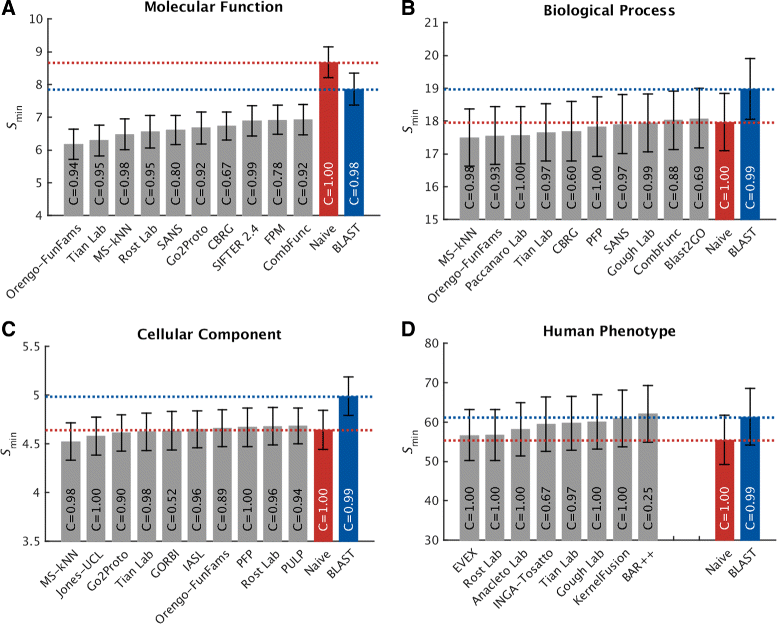
Overall evaluation using the minimum semantic distance, S min. Evaluation was carried out on no-knowledge benchmark sequences in the full mode. The coverage of each method is shown within its performance bar. A perfect predictor would be characterized with S min=0. Confidence intervals (95 %) were determined using bootstrapping with 10,000 iterations on the set of benchmark sequences. For cases in which a principal investigator participated in multiple teams, the results of only the best-scoring method are presented. Details for all methods are provided in Additional file 1
Fig. 7
Fig. 7
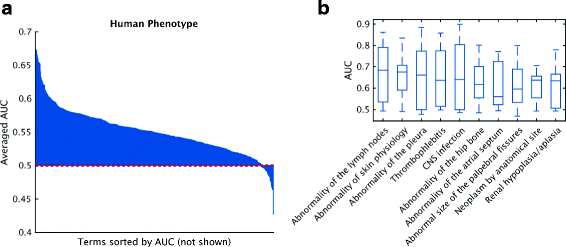
Overall evaluation using the averaged AUC over terms with no less than ten positive annotations. The evaluation was carried out on no-knowledge benchmark sequences in the full mode. Error bars indicate the standard error in averaging AUC over terms for each method. For cases in which a principal investigator participated in multiple teams, the results of only the best-scoring method are presented. Details for all methods are provided in Additional file 1. AUC receiver operating characteristic curve
Fig. 8
Fig. 8
Averaged AUC per term for Human Phenotype Ontology. a Terms are sorted based on AUC. The dashed red line indicates the performance of the Naïve method. b The top-ten accurately predicted terms without overlapping ancestors (except for the root). AUC receiver operating characteristic curve
Fig. 9
Fig. 9
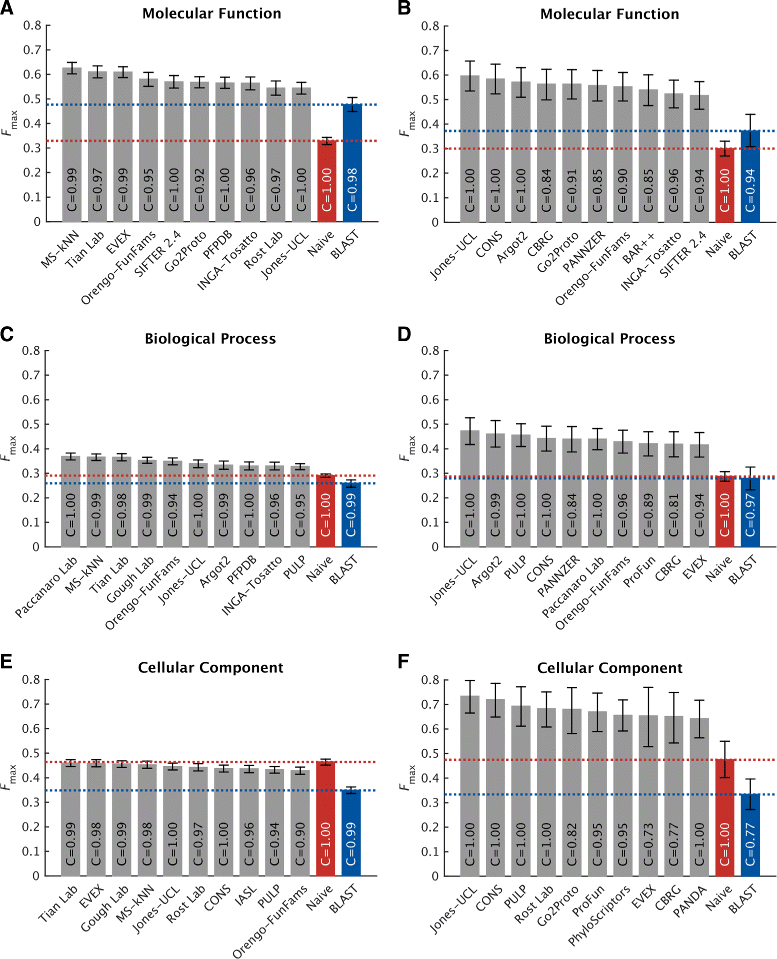
Performance evaluation using the maximum F measure, F max, on eukaryotic (left) versus prokaryotic (right) benchmark sequences. The evaluation was carried out on no-knowledge benchmark sequences in the full mode. The coverage of each method is shown within its performance bar. Confidence intervals (95 %) were determined using bootstrapping with 10,000 iterations on the set of benchmark sequences. For cases in which a principal investigator participated in multiple teams, the results of only the best-scoring method are presented. Details for all methods are provided in Additional file 1
Fig. 10
Fig. 10
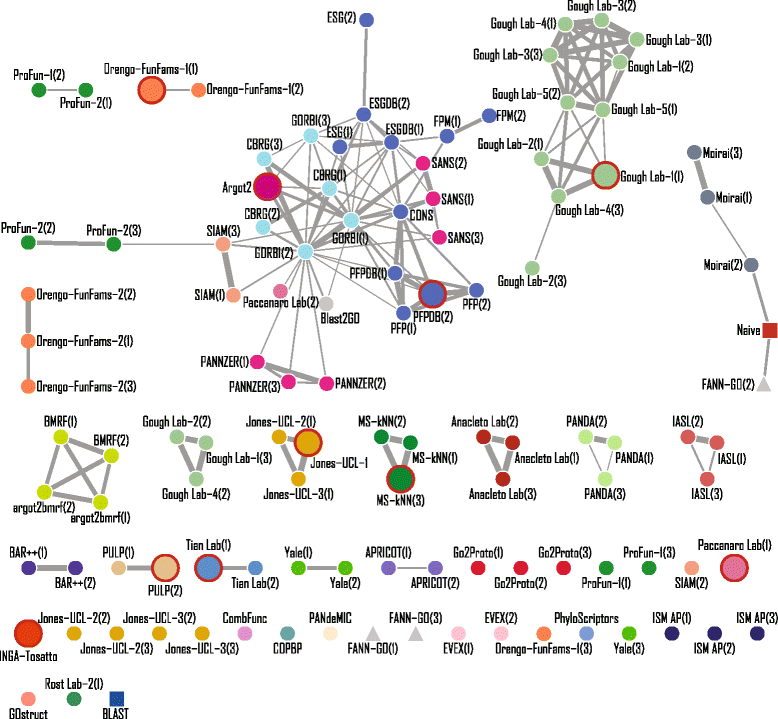
Similarity network of participating methods for BPO. Similarities are computed as Pearson’s correlation coefficient between methods, with a 0.75 cutoff for illustration purposes. A unique color is assigned to all methods submitted under the same principal investigator. Not evaluated (organizers’) methods are shown in triangles, while benchmark methods (Naïve and BLAST) are shown in squares. The top-ten methods are highlighted with enlarged nodes and circled in red. The edge width indicates the strength of similarity. Nodes are labeled with the name of the methods followed by “-team(model)” if multiple teams/models were submitted
Fig. 11
Fig. 11
Case study on the human ADAM-TS12 gene. Biological process terms associated with ADAM-TS12 gene in the union of the three databases by September 2014. The entire functional annotation of ADAM-TS12 consists of 89 terms, 28 of which are shown. Twelve terms, marked in green, are leaf terms. This directed acyclic graph was treated as ground truth in the CAFA2 assessment. Solid black lines provide direct “is a” or “part of” relationships between terms, while gray lines mark indirect relationships (that is, some terms were not drawn in this picture). Predicted terms of the top-five methods and two baseline methods were picked at their optimal F max threshold. Over-predicted terms are not shown

References

    1. Costello JC, Stolovitzky G. Seeking the wisdom of crowds through challenge-based competitions in biomedical research. Clin Pharmacol Ther. 2013;93(5):396–8. doi: 10.1038/clpt.2013.36. - DOI - PubMed
    1. Radivojac P, Clark WT, Oron TR, Schnoes AM, Wittkop T, Sokolov A, et al. A large-scale evaluation of computational protein function prediction. Nat Methods. 2013;10(3):221–7. doi: 10.1038/nmeth.2340. - DOI - PMC - PubMed
    1. Ashburner M, Ball CA, Blake JA, Botstein D, Butler H, Cherry JM, et al. Gene Ontology: tool for the unification of biology. Nat Genet. 2000;25(1):25–9. doi: 10.1038/75556. - DOI - PMC - PubMed
    1. Dessimoz C, Skunca N, Thomas PD. CAFA and the open world of protein function predictions. Trends Genet. 2013;29(11):609–10. doi: 10.1016/j.tig.2013.09.005. - DOI - PubMed
    1. Gillis J, Pavlidis P. Characterizing the state of the art in the computational assignment of gene function: lessons from the first critical assessment of functional annotation (CAFA) BMC Bioinform. 2013;14(Suppl 3):15. doi: 10.1186/1471-2105-14-S3-S15. - DOI - PMC - PubMed

Publication types