Temporal Dynamics of Antidepressant Ketamine Effects on Glutamine Cycling Follow Regional Fingerprints of AMPA and NMDA Receptor Densities
- PMID: 27604568
- PMCID: PMC5437874
- DOI: 10.1038/npp.2016.184
Temporal Dynamics of Antidepressant Ketamine Effects on Glutamine Cycling Follow Regional Fingerprints of AMPA and NMDA Receptor Densities
Abstract
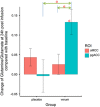
The anterior cingulate cortex (ACC) has shown decreased glutamate levels in patients with major depressive disorder. Subanesthetic doses of ketamine were repeatedly shown to improve depressive symptoms within 24 h after infusion and this antidepressant effect was attributed to increased α-amino-3-hydroxyl-5-methyl-4-isoxazole-propionate (AMPA) throughput. To elucidate ketamine's mechanism of action, we tested whether the clinical time course of the improvement is mirrored by the change of glutamine/glutamate ratio and if such effects show a regional and temporal specificity in two distinct subdivisions of ACC with different AMPA/N-methyl-D-aspartate receptor profiles. In a double-blind, placebo-controlled intravenous infusion study of ketamine, we measured glutamate and glutamine in the pregenual ACC (pgACC) and the anterior midcingulate cortex at 1 and 24 h post infusion with magnetic resonance spectroscopy at 7 T. A significant interaction of time, region, and treatment was found for the glutamine/glutamate ratios (placebo, n=14; ketamine, n=12). Post-hoc analyses revealed that the glutamine/glutamate ratio increased significantly in the ketamine group, compared with placebo, specifically in the pgACC after 24 h. The glutamine/glutamate increase in the pgACC caused by ketamine at 24 h post infusion was reproduced in an enlarged sample (placebo, n=24; ketamine, n=20). Our results support a significant temporal and regional response in glutamine/glutamate ratios to a single subanesthetic dose of ketamine, which mirrors the time course of the antidepressant response and reversal of the molecular deficits in patients and which may be associated with the histoarchitectonical receptor fingerprints of the ACC subregions.
Figures


Similar articles
-
Default mode network connectivity change corresponds to ketamine's delayed glutamatergic effects.Eur Arch Psychiatry Clin Neurosci. 2020 Mar;270(2):207-216. doi: 10.1007/s00406-018-0942-y. Epub 2018 Oct 23. Eur Arch Psychiatry Clin Neurosci. 2020. PMID: 30353262 Clinical Trial.
-
Acute effects of ketamine on the pregenual anterior cingulate: linking spontaneous activation, functional connectivity, and glutamate metabolism.Eur Arch Psychiatry Clin Neurosci. 2022 Jun;272(4):703-714. doi: 10.1007/s00406-021-01377-2. Epub 2022 Jan 12. Eur Arch Psychiatry Clin Neurosci. 2022. PMID: 35020021 Free PMC article.
-
Systematic regional variations of GABA, glutamine, and glutamate concentrations follow receptor fingerprints of human cingulate cortex.J Neurosci. 2013 Jul 31;33(31):12698-704. doi: 10.1523/JNEUROSCI.1758-13.2013. J Neurosci. 2013. PMID: 23904606 Free PMC article.
-
Antidepressant effects of ketamine and the roles of AMPA glutamate receptors and other mechanisms beyond NMDA receptor antagonism.J Psychiatry Neurosci. 2017 Jun;42(4):222-229. doi: 10.1503/jpn.160175. J Psychiatry Neurosci. 2017. PMID: 28234212 Free PMC article. Review.
-
Ketamine and other potential glutamate antidepressants.Psychiatry Res. 2015 Jan 30;225(1-2):1-13. doi: 10.1016/j.psychres.2014.10.028. Epub 2014 Nov 13. Psychiatry Res. 2015. PMID: 25467702 Review.
Cited by
-
Ten-Hour Exposure to Low-Dose Ketamine Enhances Corticostriatal Cross-Frequency Coupling and Hippocampal Broad-Band Gamma Oscillations.Front Neural Circuits. 2018 Aug 13;12:61. doi: 10.3389/fncir.2018.00061. eCollection 2018. Front Neural Circuits. 2018. PMID: 30150926 Free PMC article.
-
Pedophilic sex offenders are characterised by reduced GABA concentration in dorsal anterior cingulate cortex.Neuroimage Clin. 2018 Jan 31;18:335-341. doi: 10.1016/j.nicl.2018.01.018. eCollection 2018. Neuroimage Clin. 2018. PMID: 29876253 Free PMC article.
-
Effect of Ketamine on Limbic GABA and Glutamate: A Human In Vivo Multivoxel Magnetic Resonance Spectroscopy Study.Front Psychiatry. 2020 Sep 8;11:549903. doi: 10.3389/fpsyt.2020.549903. eCollection 2020. Front Psychiatry. 2020. PMID: 33101078 Free PMC article.
-
Richness in Functional Connectivity Depends on the Neuronal Integrity within the Posterior Cingulate Cortex.Front Neurosci. 2017 Apr 7;11:184. doi: 10.3389/fnins.2017.00184. eCollection 2017. Front Neurosci. 2017. PMID: 28439224 Free PMC article.
-
Ketamine has distinct electrophysiological and behavioral effects in depressed and healthy subjects.Mol Psychiatry. 2019 Jul;24(7):1040-1052. doi: 10.1038/s41380-018-0028-2. Epub 2018 Feb 27. Mol Psychiatry. 2019. PMID: 29487402 Free PMC article.
References
-
- Auer DP, Pütz B, Kraft E, Lipinski B, Schill J, Holsboer F (2000). Reduced glutamate in the anterior cingulate cortex in depression: an in vivo proton magnetic resonance spectroscopy study. Biol Psychiatry 47: 305–313. - PubMed
-
- Berman RM, Cappiello A, Anand A, Oren DA, Heninger GR, Charney DS et al (2000). Antidepressant effects of ketamine in depressed patients. Biol Psychiatry 47: 351–354. - PubMed
Publication types
MeSH terms
Substances
LinkOut - more resources
Full Text Sources
Other Literature Sources
Medical
Molecular Biology Databases

