

MR imaging of a novel NOE-mediated magnetization transfer with water in rat brain at 9.4 T
- PMID: 27604612
- PMCID: PMC5342948
- DOI: 10.1002/mrm.26396
MR imaging of a novel NOE-mediated magnetization transfer with water in rat brain at 9.4 T
Abstract
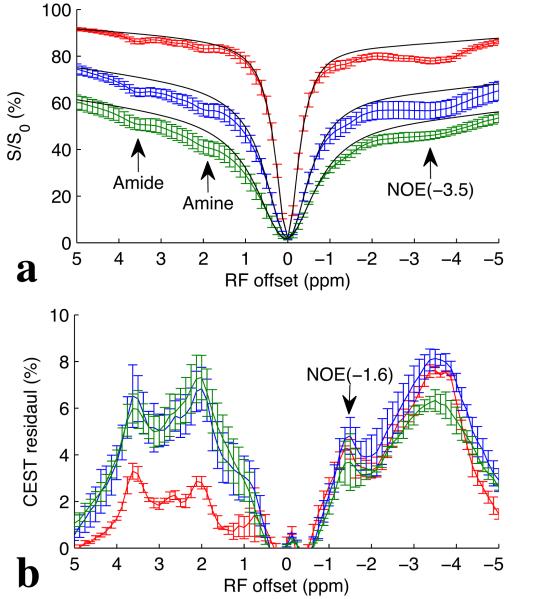
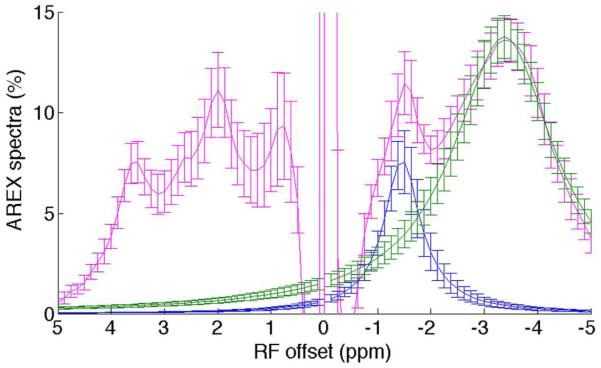
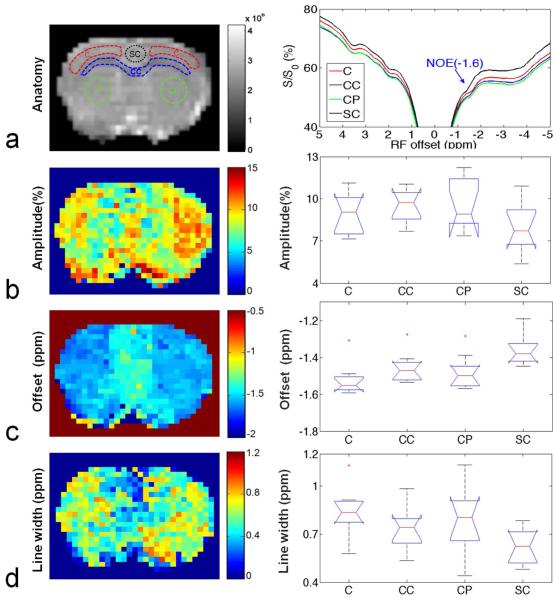
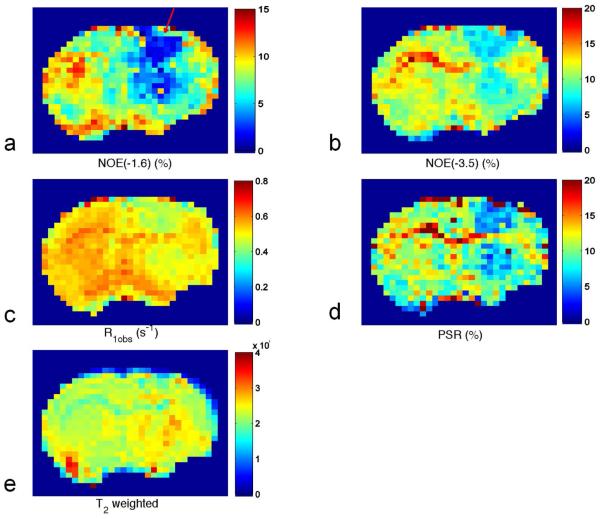
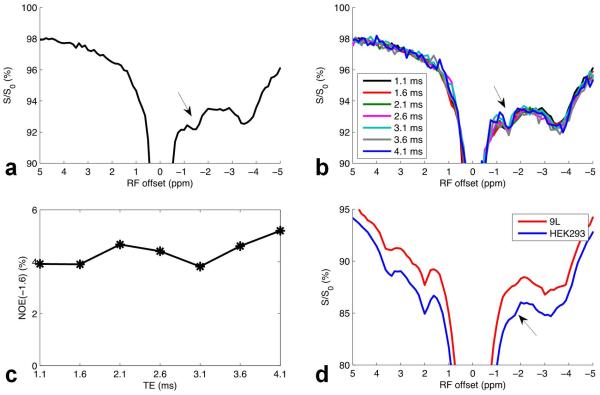
Purpose: To detect, map, and quantify a novel nuclear Overhauser enhancement (NOE)-mediated magnetization transfer (MT) with water at approximately -1.6 ppm [NOE(-1.6)] in rat brain using MRI.
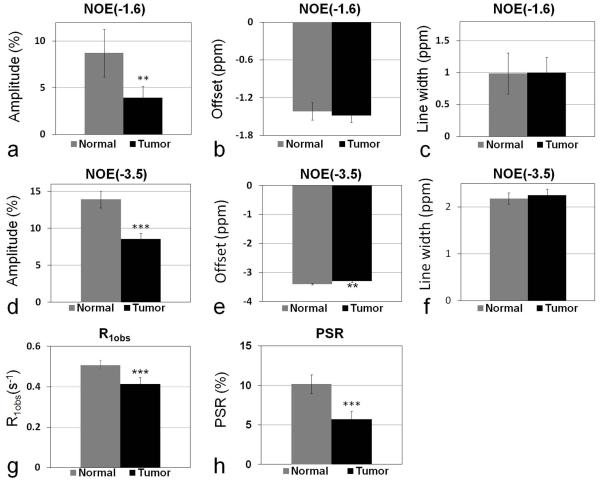
Methods: Continuous wave MT sequences with a variety of radiofrequency irradiation powers were optimized to achieve the maximum contrast of this NOE(-1.6) effect at 9.4 T. The distribution of effect magnitudes, resonance frequency offsets, and line widths in healthy rat brains and the differences of the effect between tumors and contralateral normal brains were imaged and quantified using a multi-Lorentzian fitting method. MR measurements on reconstituted model phospholipids as well as two cell lines (HEK293 and 9L) were also performed to investigate the possible molecular origin of this NOE.
Results: Our results suggest that the NOE(-1.6) effect can be detected reliably in rat brain. Pixel-wise fittings demonstrated the regional variations of the effect. Measurements in a rodent tumor model showed that the amplitude of NOE(-1.6) in brain tumor was significantly diminished compared with that in normal brain tissue. Measurements of reconstituted phospholipids suggest that this effect may originate from choline phospholipids.
Conclusion: NOE(-1.6) could be used as a new biomarker for the detection of brain tumor. Magn Reson Med 78:588-597, 2017. © 2016 International Society for Magnetic Resonance in Medicine.
Keywords: MRI; brain tumor; chemical exchange saturation transfer (CEST); magnetization transfer (MT); nuclear Overhauser enhancement (NOE).
© 2016 International Society for Magnetic Resonance in Medicine.
Figures
Similar articles
-
Quantitative assessment of the effects of water proton concentration and water T1 changes on amide proton transfer (APT) and nuclear overhauser enhancement (NOE) MRI: The origin of the APT imaging signal in brain tumor.Magn Reson Med. 2017 Feb;77(2):855-863. doi: 10.1002/mrm.26131. Epub 2016 Feb 2. Magn Reson Med. 2017. PMID: 26841096 Free PMC article.
-
Direct saturation-corrected chemical exchange saturation transfer MRI of glioma: Simplified decoupling of amide proton transfer and nuclear overhauser effect contrasts.Magn Reson Med. 2017 Dec;78(6):2307-2314. doi: 10.1002/mrm.26959. Epub 2017 Oct 13. Magn Reson Med. 2017. PMID: 29030880 Free PMC article.
-
Quantitative assessment of amide proton transfer (APT) and nuclear overhauser enhancement (NOE) imaging with extrapolated semi-solid magnetization transfer reference (EMR) signals: Application to a rat glioma model at 4.7 Tesla.Magn Reson Med. 2016 Jan;75(1):137-49. doi: 10.1002/mrm.25581. Epub 2015 Mar 5. Magn Reson Med. 2016. PMID: 25753614 Free PMC article.
-
A new NOE-mediated MT signal at around -1.6ppm for detecting ischemic stroke in rat brain.Magn Reson Imaging. 2016 Oct;34(8):1100-6. doi: 10.1016/j.mri.2016.05.002. Epub 2016 May 20. Magn Reson Imaging. 2016. PMID: 27211260 Free PMC article.
-
Clinical applications of chemical exchange saturation transfer (CEST) MRI.J Magn Reson Imaging. 2018 Jan;47(1):11-27. doi: 10.1002/jmri.25838. Epub 2017 Aug 9. J Magn Reson Imaging. 2018. PMID: 28792646 Free PMC article. Review.
Cited by
-
In vivo reproducibility of 3D relayed NOE in the healthy human brain at 7 T.Magn Reson Med. 2023 Jun;89(6):2295-2304. doi: 10.1002/mrm.29600. Epub 2023 Feb 6. Magn Reson Med. 2023. PMID: 36744726 Free PMC article.
-
Role of chemical exchange on the relayed nuclear Overhauser enhancement signal in saturation transfer MRI.Magn Reson Med. 2022 Jan;87(1):365-376. doi: 10.1002/mrm.28961. Epub 2021 Aug 12. Magn Reson Med. 2022. PMID: 34382694 Free PMC article.
-
Assessment of unilateral ureter obstruction with multi-parametric MRI.Magn Reson Med. 2018 Apr;79(4):2216-2227. doi: 10.1002/mrm.26849. Epub 2017 Jul 24. Magn Reson Med. 2018. PMID: 28736875 Free PMC article.
-
Increased CEST specificity for amide and fast-exchanging amine protons using exchange-dependent relaxation rate.NMR Biomed. 2018 Feb;31(2):10.1002/nbm.3863. doi: 10.1002/nbm.3863. Epub 2017 Nov 29. NMR Biomed. 2018. PMID: 29193448 Free PMC article.
-
Assignment of molecular origins of NOE signal at -3.5 ppm in the brain.Magn Reson Med. 2023 Aug;90(2):673-685. doi: 10.1002/mrm.29643. Epub 2023 Mar 17. Magn Reson Med. 2023. PMID: 36929814 Free PMC article.
References
-
- Zhou JY, Tryggestad E, Wen ZB, Lal B, Zhou TT, Grossman R, Wang SL, Yan K, Fu DX, Ford E, Tyler B, Blakeley J, Laterra J, van Zijl PCM. Differentiation between glioma and radiation necrosis using molecular magnetic resonance imaging of endogenous proteins and peptides. Nature Medicine. 2011;17(1):130–U308. - PMC - PubMed
-
- Haris M, Singh A, Cai KJ, Kogan F, McGarvey J, DeBrosse C, Zsido GA, Witschey WRT, Koomalsingh K, Pilla JJ, Chirinos JA, Ferrari VA, Gorman JH, Hariharan H, Gorman RC, Reddy R. A technique for in vivo mapping of myocardial creatine kinase metabolism. Nature Medicine. 2014;20(2):209–214. - PMC - PubMed
Publication types
MeSH terms
Substances
Grants and funding
LinkOut - more resources
Full Text Sources
Other Literature Sources
Medical
Miscellaneous
