A disputed evidence on obesity: comparison of the effects of Rcan2(-/-) and Rps6kb1(-/-) mutations on growth and body weight in C57BL/6J mice
- PMID: 27604858
- PMCID: PMC5018613
- DOI: 10.1631/jzus.B1600276
A disputed evidence on obesity: comparison of the effects of Rcan2(-/-) and Rps6kb1(-/-) mutations on growth and body weight in C57BL/6J mice
Abstract
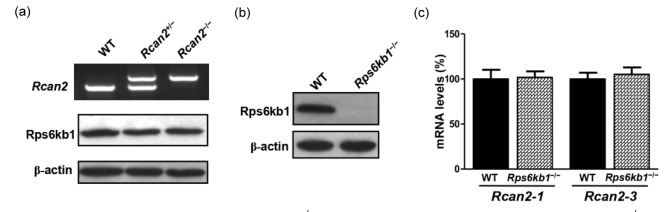
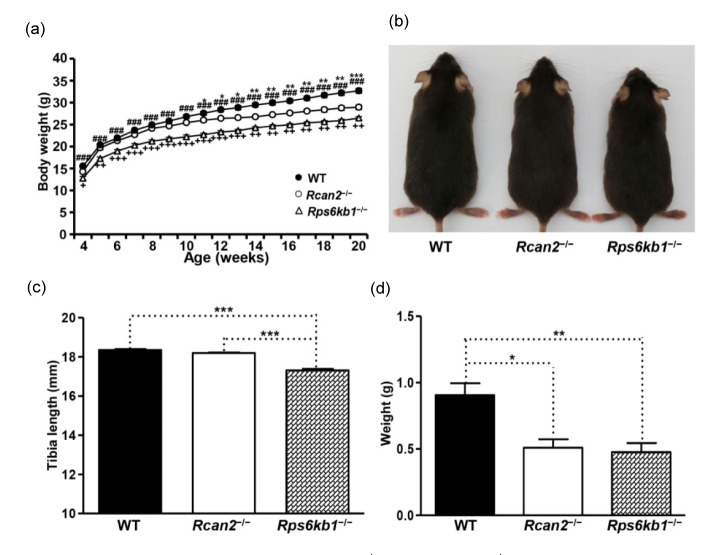
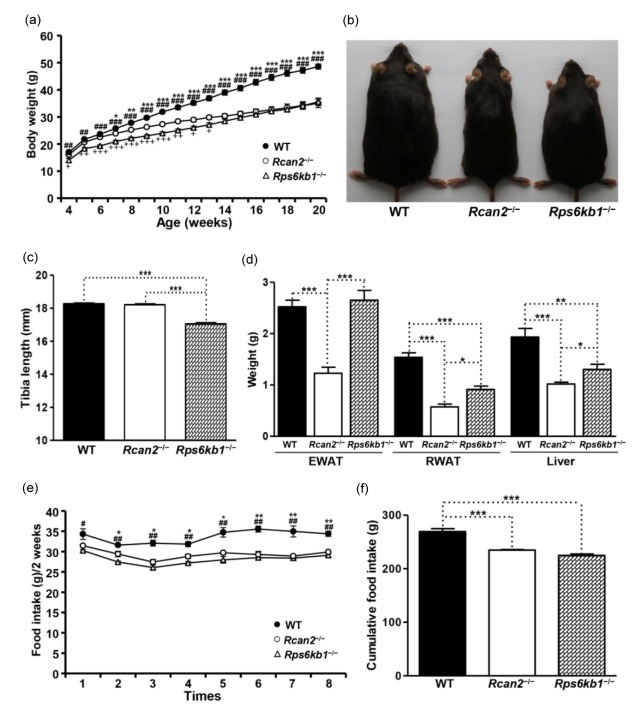
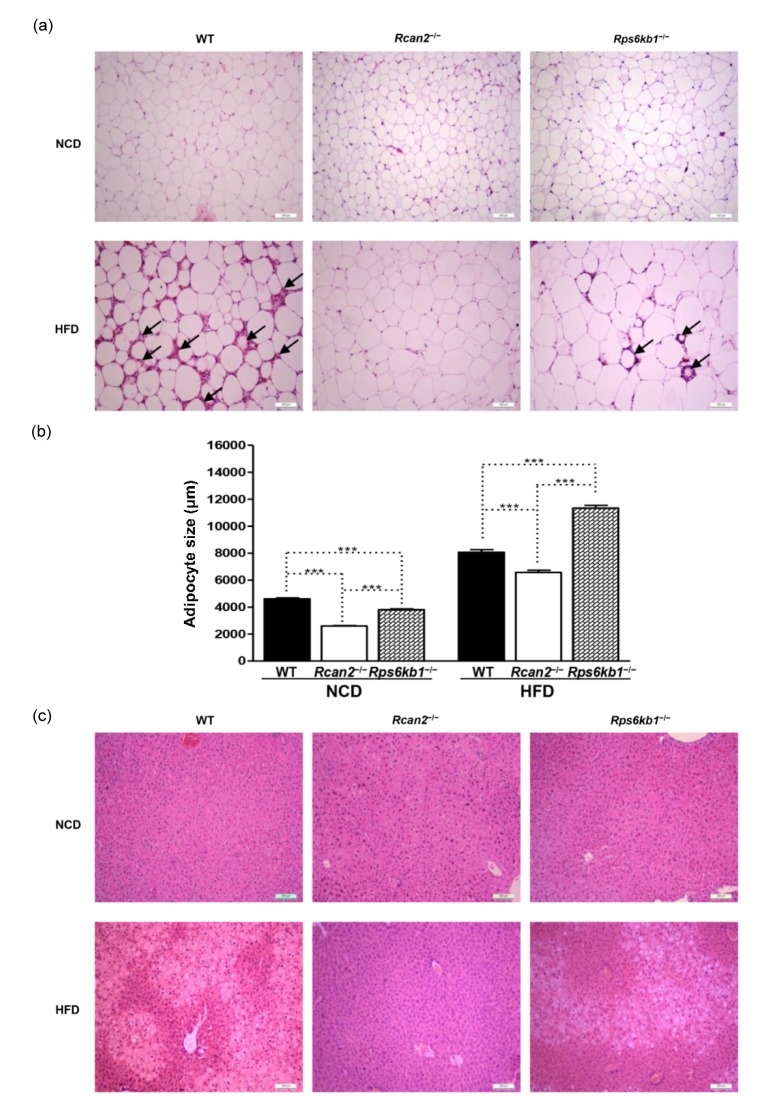
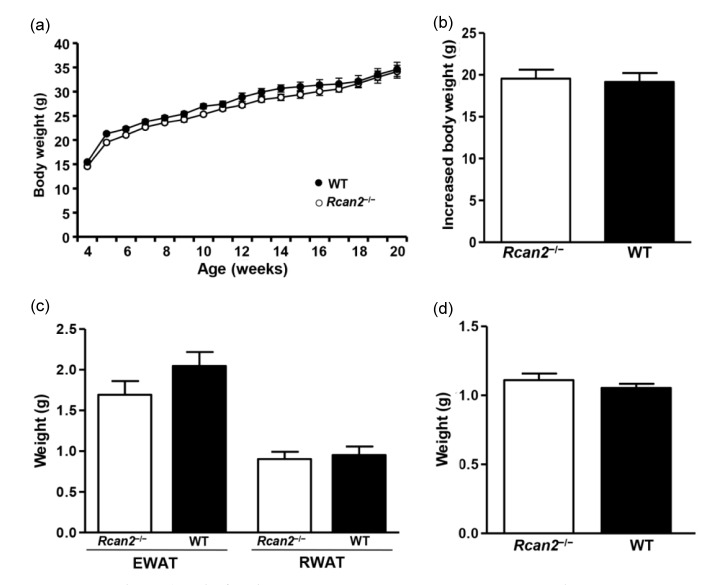
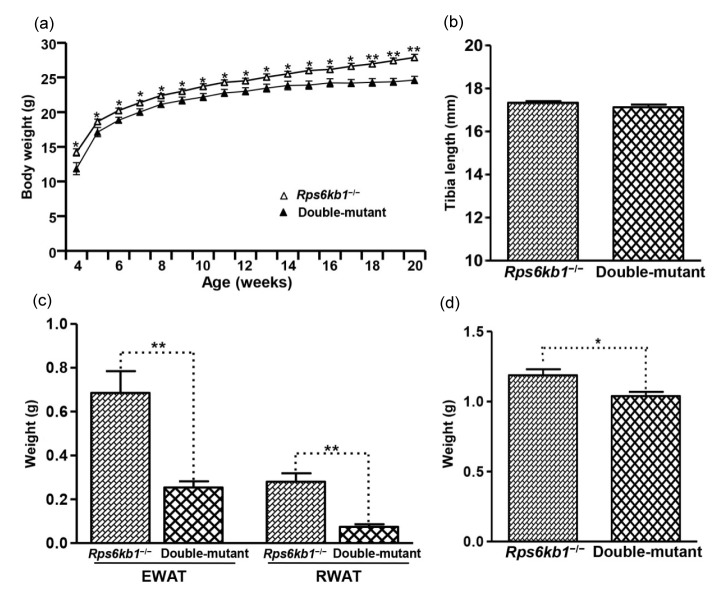
It is widely accepted that body weight and adipose mass are tightly regulated by homeostatic mechanisms, in which leptin plays a critical role through hypothalamic pathways, and obesity is a result of homeostatic disorder. However, in C57BL/6J mice, we found that Rcan2 increases food intake and plays an important role in the development of age- and diet-induced obesity through a leptin-independent mechanism. RCAN2 was initially identified as a thyroid hormone (T3)-responsive gene in human fibroblasts. Expression of RCAN2 is regulated by T3 through the PI3K-Akt/PKB-mTOR-Rps6kb1 signaling pathway. Intriguingly, both Rcan2(-/-) and Rps6kb1(-/-) mutations were reported to result in lean phenotypes in mice. In this study we compared the effects of these two mutations on growth and body weight in C57BL/6J mice. We observed reduced body weight and lower fat mass in both Rcan2(-/-) and Rps6kb1(-/-) mice compared to the wild-type mice, and we reported other differences unique to either the Rcan2(-/-) or Rps6kb1(-/-) mice. Firstly, loss of Rcan2 does not directly alter body length; however, Rcan2(-/-) mice exhibit reduced food intake. In contrast, Rps6kb1(-/-) mice exhibit abnormal embryonic development, which leads to smaller body size and reduced food intake in adulthood. Secondly, when fed a normal chow diet, Rcan2(-/-) mice weigh significantly more than Rps6kb1(-/-) mice, but both Rcan2(-/-) and Rps6kb1(-/-) mice develop similar amounts of epididymal fat. On a high-fat diet, Rcan2(-/-) mice gain body weight and fat mass at slower rates than Rps6kb1(-/-) mice. Finally, using the double-knockout mice (Rcan2(-/-) Rps6kb1(-/-)), we demonstrate that concurrent loss of Rcan2 and Rps6kb1 has an additive effect on body weight reduction in C57BL/6J mice. Our data suggest that Rcan2 and Rps6kb1 mutations both affect growth and body weight of mice, though likely through different mechanisms.
Keywords: Body weight regulation; Growth; Obesity; Rcan2 gene; Rps6kb1 gene.
Conflict of interest statement
Compliance with ethics guidelines: Jing ZHAO, Shi-wei LI, Qian-qian GONG, Ling-cui DING, Ye-cheng JIN, Jian ZHANG, Jian-gang GAO, and Xiao-yang SUN declare that they have no conflict of interest. All institutional and national guidelines for the care and use of laboratory animals were followed.
Figures
Similar articles
-
Rcan2 and estradiol independently regulate body weight in female mice.Oncotarget. 2017 Jul 18;8(29):48098-48109. doi: 10.18632/oncotarget.18259. Oncotarget. 2017. PMID: 28624805 Free PMC article.
-
Dual specificity phosphatase 6 deficiency is associated with impaired systemic glucose tolerance and reversible weight retardation in mice.PLoS One. 2017 Sep 5;12(9):e0183488. doi: 10.1371/journal.pone.0183488. eCollection 2017. PLoS One. 2017. PMID: 28873424 Free PMC article.
-
Inactivation of the Rcan2 gene in mice ameliorates the age- and diet-induced obesity by causing a reduction in food intake.PLoS One. 2011 Jan 27;6(1):e14605. doi: 10.1371/journal.pone.0014605. PLoS One. 2011. PMID: 21298050 Free PMC article.
-
Genes involved in animal models of obesity and anorexia.J Intern Med. 1999 Jun;245(6):613-9. doi: 10.1046/j.1365-2796.1999.00489.x. J Intern Med. 1999. PMID: 10395190 Review.
-
The dual hypothesis of homeostatic body weight regulation, including gravity-dependent and leptin-dependent actions.Philos Trans R Soc Lond B Biol Sci. 2023 Oct 23;378(1888):20220219. doi: 10.1098/rstb.2022.0219. Epub 2023 Sep 4. Philos Trans R Soc Lond B Biol Sci. 2023. PMID: 37661748 Free PMC article. Review.
Cited by
-
Association Between Circulating Regulator of Calcineurin 2 Concentrations With Overweight and Obesity.Front Endocrinol (Lausanne). 2022 Jun 6;13:857841. doi: 10.3389/fendo.2022.857841. eCollection 2022. Front Endocrinol (Lausanne). 2022. PMID: 35733783 Free PMC article.
-
Elevated Serum Regulator of Calcineurin 2 is Associated With an Increased Risk of Non-Alcoholic Fatty Liver Disease.Front Pharmacol. 2022 Mar 16;13:840764. doi: 10.3389/fphar.2022.840764. eCollection 2022. Front Pharmacol. 2022. PMID: 35370729 Free PMC article.
-
Rcan2 and estradiol independently regulate body weight in female mice.Oncotarget. 2017 Jul 18;8(29):48098-48109. doi: 10.18632/oncotarget.18259. Oncotarget. 2017. PMID: 28624805 Free PMC article.
References
-
- Baker J, Liu JP, Robertson EJ, et al. Role of insulin-like growth factors in embryonic and postnatal growth. Cell. 1993;75(1):73–82. - PubMed
-
- Bassett JH, Logan JG, Boyde A, et al. Mice lacking the calcineurin inhibitor Rcan2 have an isolated defect of osteoblast function. Endocrinology. 2012;153(7):3537–3548. (Available from: http://dx.doi.org/10.1210/en.2011-1814) - DOI - PubMed
-
- Black BL, Croom J, Eisen EJ, et al. Differential effects of fat and sucrose on body composition in A/J and C57BL/6 mice. Metabolism. 1998;47(11):1354–1359. - PubMed
-
- Blouet C, Ono H, Schwartz GJ. Mediobasal hypothalamic p70 S6 kinase 1 modulates the control of energy homeostasis. Cell Metab. 2008;8(6):459–467. (Available from: http://dx.doi.org/10.1016/j.cmet.2008.10.004) - DOI - PMC - PubMed
-
- Bray GA, Popkin BM. Dietary fat intake does affect obesity! Am J Clin Nutr. 1998;68(6):1157–1173. - PubMed
MeSH terms
Substances
LinkOut - more resources
Full Text Sources
Other Literature Sources
Medical
Molecular Biology Databases
Research Materials
Miscellaneous