. 2016 Nov 2;44(19):9096-9109.
doi: 10.1093/nar/gkw770. Epub 2016 Sep 6.

DNA-binding protects p53 from interactions with cofactors involved in transcription-independent functions

Affiliations

DNA-binding protects p53 from interactions with cofactors involved in transcription-independent functions

Matteo Lambrughi et al. Nucleic Acids Res. .

Abstract

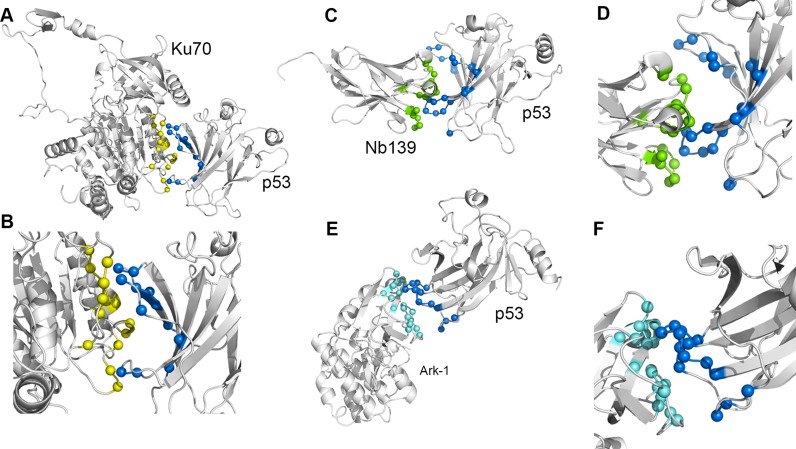
Binding-induced conformational changes of a protein at regions distant from the binding site may play crucial roles in protein function and regulation. The p53 tumour suppressor is an example of such an allosterically regulated protein. Little is known, however, about how DNA binding can affect distal sites for transcription factors. Furthermore, the molecular details of how a local perturbation is transmitted through a protein structure are generally elusive and occur on timescales hard to explore by simulations. Thus, we employed state-of-the-art enhanced sampling atomistic simulations to unveil DNA-induced effects on p53 structure and dynamics that modulate the recruitment of cofactors and the impact of phosphorylation at Ser215. We show that DNA interaction promotes a conformational change in a region 3 nm away from the DNA binding site. Specifically, binding to DNA increases the population of an occluded minor state at this distal site by more than 4-fold, whereas phosphorylation traps the protein in its major state. In the minor conformation, the interface of p53 that binds biological partners related to p53 transcription-independent functions is not accessible. Significantly, our study reveals a mechanism of DNA-mediated protection of p53 from interactions with partners involved in the p53 transcription-independent signalling. This also suggests that conformational dynamics is tightly related to p53 signalling.


Figures

Figure 1.
Figure 1.
(A) Structural features of the p53 DBD. The 3D structure of p53 DBD in complex with DNA (PDB entry 1TSR) is shown as a cartoon of different shades of colours from the N- (yellow) to the C-terminus (green). (B) Substates of the S6-S7 loop in the 2D subspace described by the first and second PCs. The different substates are indicated by capital letters (A-D). The average 3D structure identified for each substate is represented as a cartoon and the conformations of the S6-S7 loop are highlighted in red, orange, yellow, green and cyan for A, B, C and D, respectively.
Figure 2.
Figure 2.
(A) Average structure of each conformational substate of the principal component analysis (PCA) subspace. The average conformations from A-D are shown as red, orange, yellow and green cartoons, respectively. The DNA-interacting residues (Lys120, Arg248, Arg273, Arg280) are shown as sticks. We here show the coupling between the different structural states of S6-S7 loop and conformations of L1 loop ranging from states not competent for DNA interaction as A (red) and D (green) and DNA-bound-like states as B (orange) and C (yellow). The DNA is taken from the initial structure (PDB entry 1TSR, chain B) and shown as a reference in grey. (B) Conformations of loop L1 in extended (pink) or recessed (blue) state in the X-ray structure of p53 tetramer (PDB entry 3Q06 monomer B and C). The L1 loop and the S6-S7 loop of a conformation from a generalized masked delaunay (GMD) minimum are shown as red cartoons for reference. (C–L) Activity level during p53DBD-DNA (C–H) and p53DBD (I–L) simulations. We used an approach that employs a contact metric based on higher-order statistics (GMD) to describe conformational changes in the p53 DBD, measured as activity (see Materials and Methods). The GMD activity plot is reported for each simulation. We identified basins of minimal activity (GMD minima) of the trajectories, and the corresponding structures are reported as cartoons in Supplementary Figure S6. We showed the conformations of the S6-S7 and L1 loops in each GMD minimum compared to the states observed by (A) PCA and the recessed and extended states observed in X-ray structure of (B) p53 tetramer (PDB entry 3Q06), respectively. Structural states of the S6-S7 loop in GMD minima are represented by spheres coloured according to the structural similarity with average conformations of substates identified by PCA (A) (A red, B orange, C yellow, D green) measured by Cα RMSD of the S6-S7 loop. Structural states of the L1 loop in GMD minima are represented by rectangular boxes coloured according to their structural similarity with extended (pink) or recessed (blue) state in the X-ray structure of p53 tetramer (B) (PDB entry 3Q06, monomers B and C, respectively) measured by Cα RMSD of L1 loop.
Figure 3.
Figure 3.
(A) Sub-networks of hydrogen bonds in MD p53 DBD(91–289) simulations. We here show the cluster of hydrogen bonds that involve Thr211 and Arg213 in the S6-S7 loop, Ser94 and Ser90 of the N-terminal tail, along with Thr170 and Glu171 in the L2 loop. The Cα atoms of the residues involved in hydrogen bonds between the S6-S7 loop, the N-terminal tail and other regions are shown as spheres. The Cα atoms of the interacting residues are connected by sticks, whose thickness is proportional to the persistence of the interaction. The analysis was carried out by PyInteraph (96). (B and C) Paths of long-range communication from the L1 to S6-S7 loop. The communication paths are shown as orange (occurrence probability > 0.25) or yellow (occurrence probability < 0.25) sticks. The terminal nodes of the paths are highlighted as blue and red spheres centred on the Cα atoms for the S6-S7 and L1 loops, respectively. The paths calculated from both (B) DNA-unbound simulations and (C) DNA-bound simulations are shown. S6-S7 loop is highlighted in blue. The paths are listed in Supplementary Table S1.
Figure 4.
Figure 4.
Interaction with DNA alters the free energy landscape of p53 DBD. The 2D free energy surface (FES) profiles are shown for two out of the four collective variables employed in PT-metaD simulations. p53DBD(91–289) and p53DBD–DNA(91–289) are shown on the left and right panels, respectively. B and C-like occluded states (the minima corresponding to lower distances in the plots) are only a minor population in the free state, whereas their population increases by more than four fold upon DNA binding. The conformation of the loop and the disordered N-terminal tail in each basin of the FES are shown in red, orange, yellow and green, for A, B, C and D states, respectively. We show only the structure of the p53 DBD for sake of clarity. The average structure for each p53 state from the unbiased MD simulations is shown as a reference in white cartoons. The other 2D FES profiles are reported in Supplementary Figure S2B.
Figure 5.
Figure 5.
Minor and major states are consistently described by different MD protein force fields and phosphorylation of Ser215 traps the p53 DBD in the major conformation of S6-S7 loop. The 2D FES profiles are shown for two out of the four collective variables employed in PT-metaD simulations. p53DBD(91–289) and p53DBD–DNA(91–289) with CHARMM22* force field are shown on the upper left and right panels, respectively. p53DBD(91–289) with phosphorylation at Ser215 is shown in the bottom panel. A different protein force field (CHARMM22*) provides results consistent with a conformational shift upon DNA binding in loop S6-S7 towards more occluded states of the loop. Phosphorylation at Ser215 traps the protein in its major state A, also observed in the X-ray available structures of the protein.
Figure 6.
Figure 6.
Comparison of calculated and experimental Cα and Cβ chemical shifts. We predicted Cα and Cβ chemical shifts using PPM (76) and compared them to published NMR chemical shifts of p53DBD (38) calculating a χ2 for each atom, accounting also for the errors associated to the prediction of that specific class of atoms as reported in (76). In the figure, the results for the residues in the S6-S7 loop and the residue Leu206 in position -1 with respect to the loop are reported using as reference the metaD ensemble and the two different experimental structures used as starting structure of p53 DBD simulations. We can observe a drop in χ2 for most of the residues when the metaD ensemble is used.
Figure 7.
Figure 7.
Complex predicted by PRISM for (A and B) Ku70 and (E and F) Ark-1 p53 DBD. The complex predicted for interaction of Ku70 (PDB entry 1JEY, (97)) and Ark-1 (PDB entry 1MUO (98)) and p53 DBD is depicted as an example of the predicted interfaces reported in Supplementary Table S2. Moreover the crystallographic structure of the complex between (C and D) Nb139 and p53 DBD is shown for comparison. Structures are shown as a cartoon. We calculated the residues of the two proteins in each complex that have at least one atom within 5 Å of distance from the atoms of the binding partner and we highlighted their Cα atoms with coloured spheres. p53 DBD is highlighted in blue, Ku70 in yellow, Ark-1 in cyan and Nb139 in green. The other interactors identified by PRISM and modulated by different S6-S7 conformations are described in details in the Supplementary Table S2.

Similar articles

Cited by

References

    1. Cui Q., Karplus M. Allostery and cooperativity revisited. Protein Sci. 2008;17:1295–1307. - PMC - PubMed
    1. Changeux J.-P. Allostery and the Monod-Wyman-Changeux model after 50 years. Annu. Rev. Biophys. 2012;41:103–133. - PubMed
    1. Tsai C.-J., Nussinov R. A unified view of ‘how allostery works’. PLoS Comput. Biol. 2014;10:e1003394. - PMC - PubMed
    1. Ribeiro A.A.S.T., Ortiz V. A chemical perspective on allostery. Chem. Rev. 2016;116:6488–6502. - PubMed
    1. Papaleo E., Saladino G., Lambrughi M., Lindorff-Larsen K., Gervasio F.L., Nussinov R. The role of protein loops and linkers in conformational dynamics and allostery. Chem. Rev. 2016;116:6391–6423. - PubMed