

Phylogenetic Resolution of Deep Eukaryotic and Fungal Relationships Using Highly Conserved Low-Copy Nuclear Genes
- PMID: 27604879
- PMCID: PMC5631032
- DOI: 10.1093/gbe/evw196
Phylogenetic Resolution of Deep Eukaryotic and Fungal Relationships Using Highly Conserved Low-Copy Nuclear Genes
Abstract
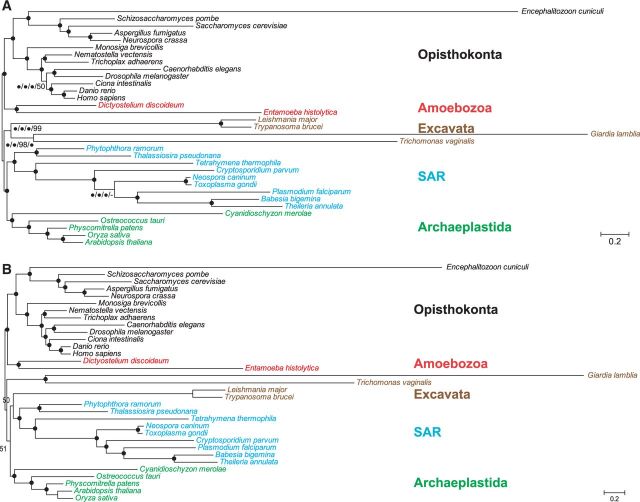
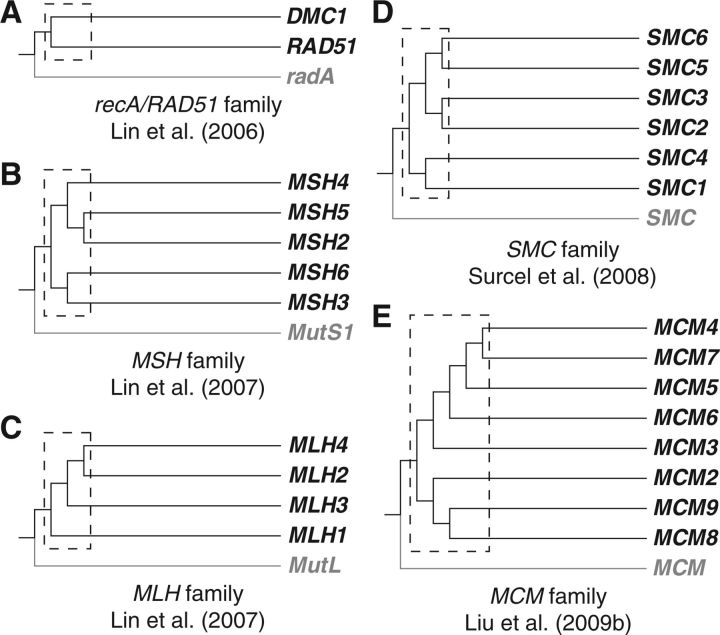
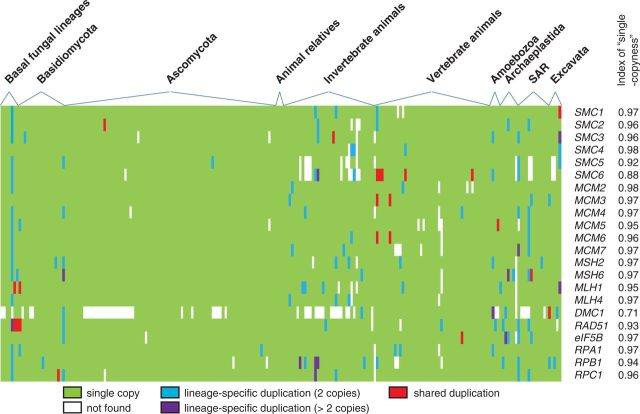
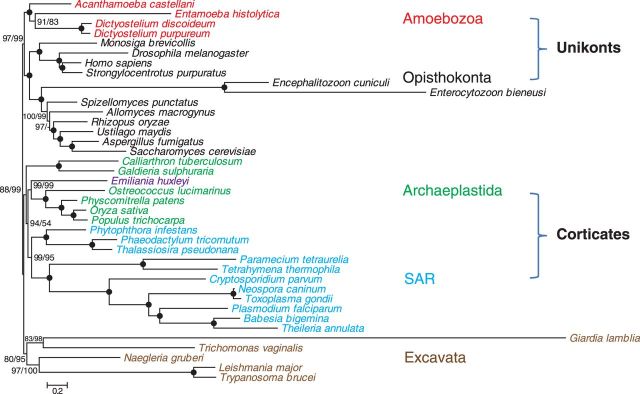
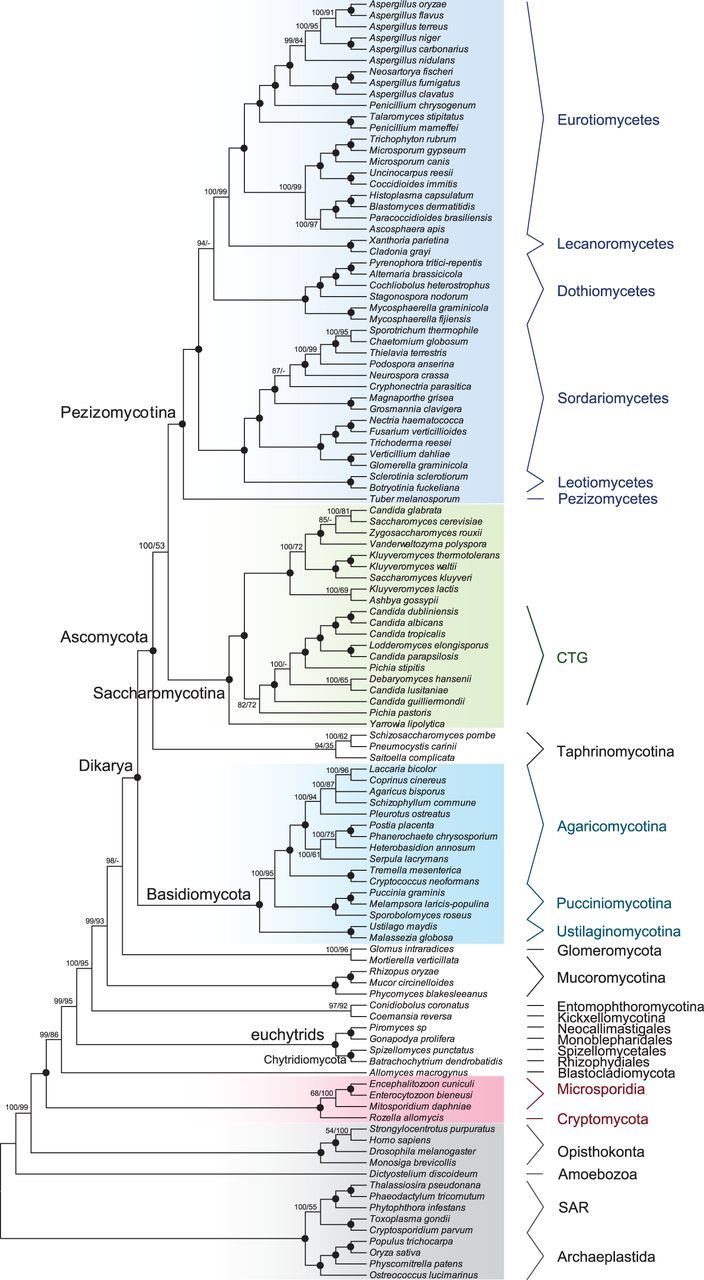
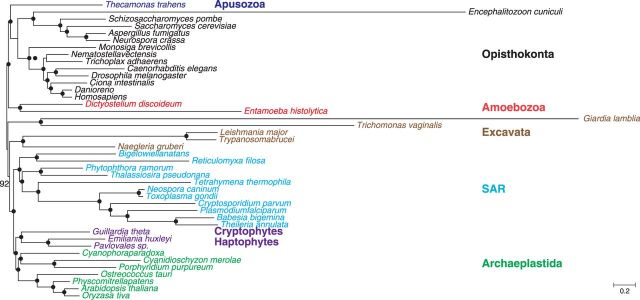
A comprehensive and reliable eukaryotic tree of life is important for many aspects of biological studies from comparative developmental and physiological analyses to translational medicine and agriculture. Both gene-rich and taxon-rich approaches are effective strategies to improve phylogenetic accuracy and are greatly facilitated by marker genes that are universally distributed, well conserved, and orthologous among divergent eukaryotes. In this article, we report the identification of 943 low-copy eukaryotic genes and we show that many of these genes are promising tools in resolving eukaryotic phylogenies, despite the challenges of determining deep eukaryotic relationships. As a case study, we demonstrate that smaller subsets of ∼20 and 52 genes could resolve controversial relationships among widely divergent taxa and provide strong support for deep relationships such as the monophyly and branching order of several eukaryotic supergroups. In addition, the use of these genes resulted in fungal phylogenies that are congruent with previous phylogenomic studies that used much larger datasets, and successfully resolved several difficult relationships (e.g., forming a highly supported clade with Microsporidia, Mitosporidium and Rozella sister to other fungi). We propose that these genes are excellent for both gene-rich and taxon-rich analyses and can be applied at multiple taxonomic levels and facilitate a more complete understanding of the eukaryotic tree of life.
Keywords: eukaryotic phylogeny; fungal phylogeny; phylogenomics; single-copy genes.
© The Author(s) 2016. Published by Oxford University Press on behalf of the Society for Molecular Biology and Evolution.
Figures
Similar articles
-
Assessing the microsporidia-fungi relationship: Combined phylogenetic analysis of eight genes.Gene. 2006 Jun 21;375:103-9. doi: 10.1016/j.gene.2006.02.023. Epub 2006 Mar 20. Gene. 2006. PMID: 16626896
-
Loss of the flagellum happened only once in the fungal lineage: phylogenetic structure of kingdom Fungi inferred from RNA polymerase II subunit genes.BMC Evol Biol. 2006 Sep 29;6:74. doi: 10.1186/1471-2148-6-74. BMC Evol Biol. 2006. PMID: 17010206 Free PMC article.
-
The phylogenetic position of red algae revealed by multiple nuclear genes from mitochondria-containing eukaryotes and an alternative hypothesis on the origin of plastids.J Mol Evol. 2003 Apr;56(4):485-97. doi: 10.1007/s00239-002-2419-9. J Mol Evol. 2003. PMID: 12664168
-
Untangling the phylogeny of amoeboid protists.J Eukaryot Microbiol. 2009 Jan-Feb;56(1):16-25. doi: 10.1111/j.1550-7408.2008.00379.x. J Eukaryot Microbiol. 2009. PMID: 19335771 Review.
-
Early branching eukaryotes?Curr Opin Genet Dev. 1998 Dec;8(6):624-9. doi: 10.1016/s0959-437x(98)80029-4. Curr Opin Genet Dev. 1998. PMID: 9914207 Review.
Cited by
-
Phylogenetic taxon definitions for Fungi, Dikarya, Ascomycota and Basidiomycota.IMA Fungus. 2018 Jul;9:291-298. doi: 10.5598/imafungus.2018.09.02.05. Epub 2018 Sep 12. IMA Fungus. 2018. PMID: 30622884 Free PMC article.
-
Evolutionary, structural and functional analysis of the caleosin/peroxygenase gene family in the Fungi.BMC Genomics. 2018 Dec 28;19(1):976. doi: 10.1186/s12864-018-5334-1. BMC Genomics. 2018. PMID: 30593269 Free PMC article.
-
Gene Duplications Trace Mitochondria to the Onset of Eukaryote Complexity.Genome Biol Evol. 2021 May 7;13(5):evab055. doi: 10.1093/gbe/evab055. Genome Biol Evol. 2021. PMID: 33739376 Free PMC article.
-
Multigene phylogeny and cell evolution of chromist infrakingdom Rhizaria: contrasting cell organisation of sister phyla Cercozoa and Retaria.Protoplasma. 2018 Sep;255(5):1517-1574. doi: 10.1007/s00709-018-1241-1. Epub 2018 Apr 17. Protoplasma. 2018. PMID: 29666938 Free PMC article.
-
The Conservation of the Germline Multipotency Program, from Sponges to Vertebrates: A Stepping Stone to Understanding the Somatic and Germline Origins.Genome Biol Evol. 2017 Mar 1;9(3):474-488. doi: 10.1093/gbe/evw289. Genome Biol Evol. 2017. PMID: 28082608 Free PMC article.
References
-
- Adl SM, et al. 2005. The new higher level classification of eukaryotes with emphasis on the taxonomy of protists. J Eukaryot Microbiol. 52:399–451. - PubMed
-
- Aguileta G, et al. 2008. Assessing the performance of single-copy genes for recovering robust phylogenies. Syst Biol. 57:613–627. - PubMed
-
- Andersson JO. 2009. Gene transfer and diversification of microbial eukaryotes. Annu Rev Microbiol. 63:177–193. - PubMed
-
- Andersson JO. 2011. Evolution of patchily distributed proteins shared between eukaryotes and prokaryotes: dictyostelium as a case study. J Mol Microbiol Biotechnol. 20:83–95. - PubMed
MeSH terms
Substances
LinkOut - more resources
Full Text Sources
Other Literature Sources
Research Materials
