. 2016 Nov 1;37(11):1041-1051.
doi: 10.1093/carcin/bgw093.

TGF-β-induced stromal CYR61 promotes resistance to gemcitabine in pancreatic ductal adenocarcinoma through downregulation of the nucleoside transporters hENT1 and hCNT3

Affiliations

TGF-β-induced stromal CYR61 promotes resistance to gemcitabine in pancreatic ductal adenocarcinoma through downregulation of the nucleoside transporters hENT1 and hCNT3

Rachel A Hesler et al. Carcinogenesis. .

Abstract

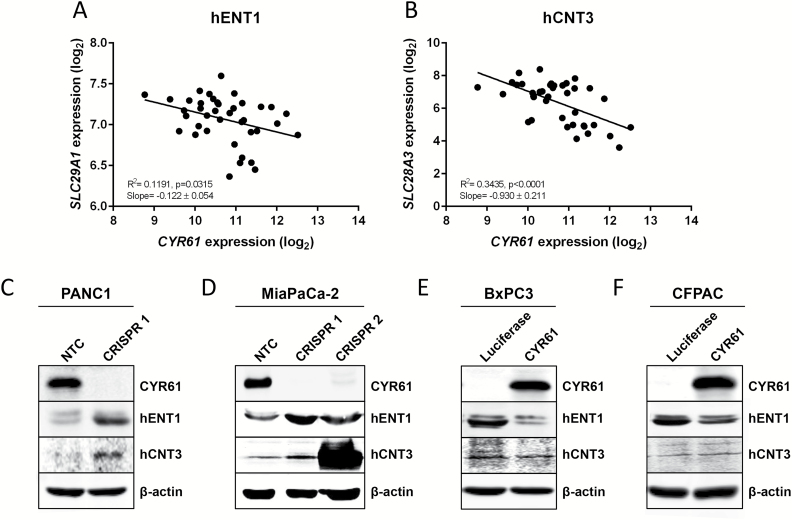
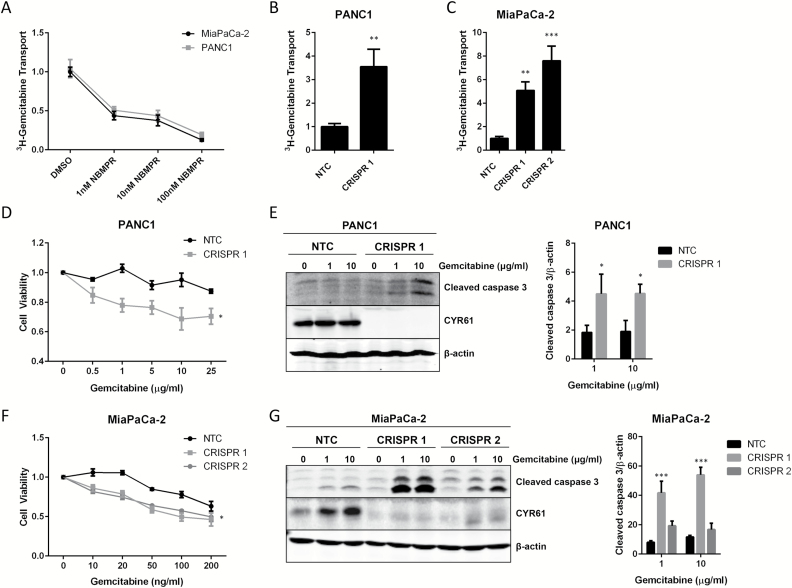
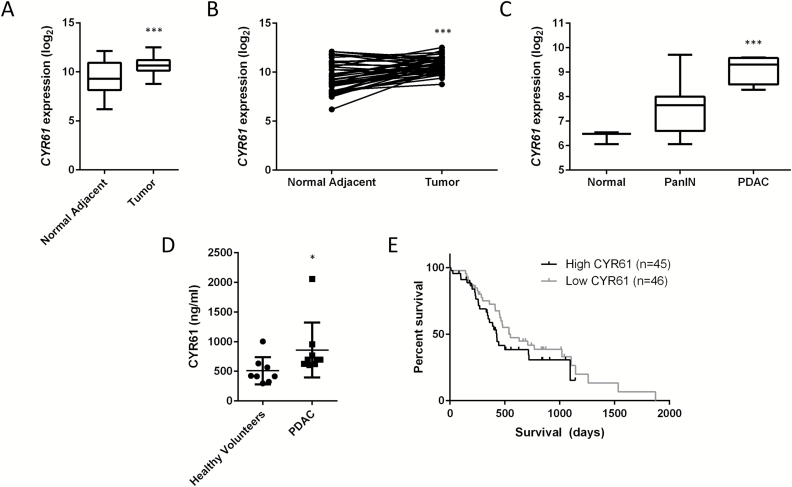
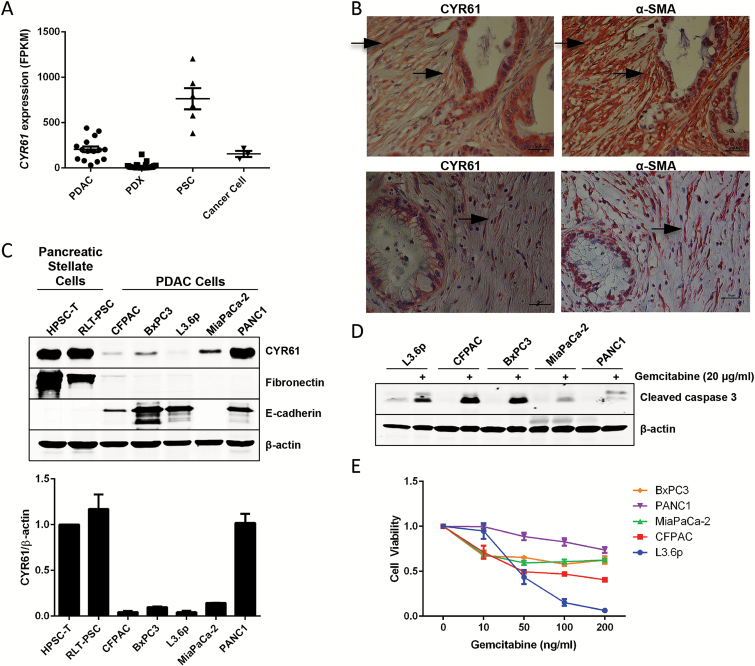
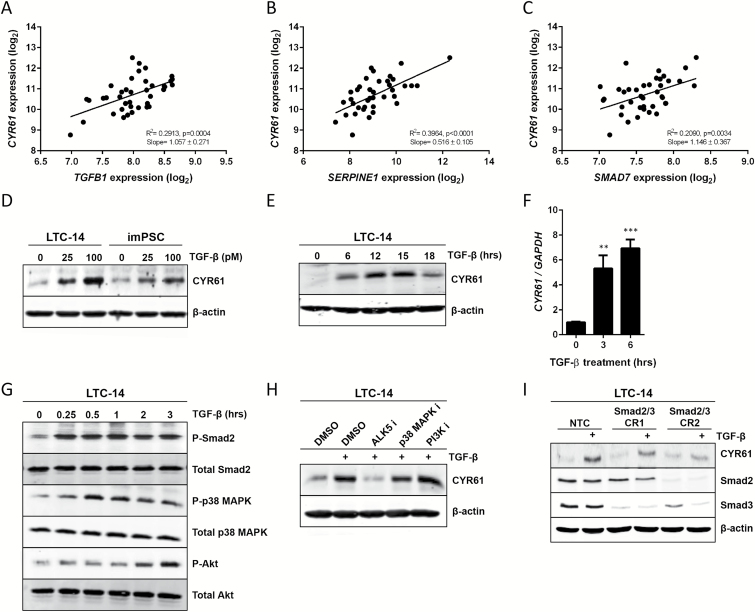
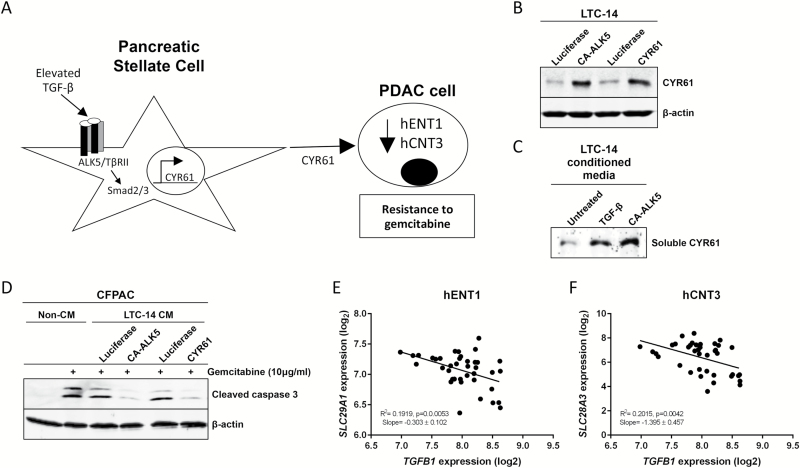
Pancreatic ductal adenocarcinoma (PDAC) is a lethal cancer in part due to inherent resistance to chemotherapy, including the first-line drug gemcitabine. Although low expression of the nucleoside transporters hENT1 and hCNT3 that mediate cellular uptake of gemcitabine has been linked to gemcitabine resistance, the mechanisms regulating their expression in the PDAC tumor microenvironment are largely unknown. Here, we report that the matricellular protein cysteine-rich angiogenic inducer 61 (CYR61) negatively regulates the nucleoside transporters hENT1 and hCNT3. CRISPR/Cas9-mediated knockout of CYR61 increased expression of hENT1 and hCNT3, increased cellular uptake of gemcitabine and sensitized PDAC cells to gemcitabine-induced apoptosis. In PDAC patient samples, expression of hENT1 and hCNT3 negatively correlates with expression of CYR61 . We demonstrate that stromal pancreatic stellate cells (PSCs) are a source of CYR61 within the PDAC tumor microenvironment. Transforming growth factor-β (TGF-β) induces the expression of CYR61 in PSCs through canonical TGF-β-ALK5-Smad2/3 signaling. Activation of TGF-β signaling or expression of CYR61 in PSCs promotes resistance to gemcitabine in PDAC cells in an in vitro co-culture assay. Our results identify CYR61 as a TGF-β-induced stromal-derived factor that regulates gemcitabine sensitivity in PDAC and suggest that targeting CYR61 may improve chemotherapy response in PDAC patients.


Figures

Figure 1.
Figure 1.
CYR61 negatively regulates the nucleoside transporters hENT1 and hCNT3 in PDAC cells. (A, B) Linear regression using the microarray dataset GDS4103. n = 39 patient samples: (A) hENT1 (SLC29A1) and (B) hCNT3 (SLC28A3). (C) Western blots for CYR61 (Santa Cruz), hENT1 and hCNT3 in PANC1 NTC and CYR61 CRISPR 1 knockout cells. Results are representative of five independent experiments. (D) Western blots for CYR61 (Santa Cruz), hENT1 and hCNT3 in MiaPaCa-2 cells for NTC, CYR61 CRISPR 1 and CYR61 CRISPR 2 knockout cells. Results are representative of four independent experiments. (E) Western blots for CYR61 (Abcam), hENT1 and hCNT3 in BxPC3 cells infected with CYR61 adenovirus or control luciferase adenovirus at an MOI of 100 for 48h. Results are representative of three independent experiments. (F) Western blots for CYR61 (Abcam), hENT1 and hCNT3 in CFPAC cells infected with CYR61 adenovirus or control luciferase adenovirus at an MOI of 100 for 48h. Results are representative of three independent experiments. (BF) Western blotting results are quantified in Supplementary Figure 2.
Figure 2.
Figure 2.
CYR61 inhibits gemcitabine transport and promotes resistance to gemcitabine-induced apoptosis. (A) Gemcitabine transport assay in MiaPaCa-2 and PANC1 cells using hENT1 inhibitor NBMPR at indicated doses. Gemcitabine transport expressed as CPM/protein normalized to DMSO. n = 3 independent replicates, each condition performed in triplicate. (B) Gemcitabine transport assay in PANC1 cells. Gemcitabine transport expressed as CPM/protein normalized to NTC. t test **P = 0.0039. n = 3 independent replicates, each condition performed in triplicate. (C) Gemcitabine transport assay in MiaPaCa-2 cells. Gemcitabine transport expressed as CPM/protein normalized to NTC. ANOVA/Fisher’s LSD, NTC versus CR1 **P = 0.0023, NTC versus CR2 ***P < 0.0001. n = 3 independent replicates, each condition performed in triplicate. (D) Cell Titer Glo assay measuring cell viability of PANC1 cells after 48h treatment with a dose course of gemcitabine. Two-way ANOVA, effect of CRISPR ***P < 0.0001, interaction of CRISPR and gemcitabine treatment *P = 0.0320. n = 3 independent replicates, each condition performed in triplicate. (E) Western blot of cleaved caspase 3 and CYR61 (Santa Cruz) for PANC1 NTC and CYR61 CRISPR cells treated with a dose course of gemcitabine for 48h. Two-way ANOVA, effect of CRISPR *P = 0.0108. n = 4 independent replicates. (F) Cell Titer Glo assay measuring cell viability of MiaPaCa-2 cells after 48h treatment with a dose course of gemcitabine. Two-way ANOVA, effect of CRISPR ***P < 0.0001, interaction of CRISPR and gemcitabine treatment *P = 0.0127. n = 3 independent replicates, each condition performed in triplicate. (G) Western blot of cleaved caspase 3 and CYR61 (Santa Cruz) for MiaPaCa-2 NTC and CYR61 CRISPR cells treated with a dose course of gemcitabine for 48h. Two-way ANOVA, effect of CRISPR ***P < 0.0001, Fisher’s LSD, NTC versus CR1 ***P < 0.0001, NTC versus CR2 P = 0.0965. n = 3 independent replicates.
Figure 3.
Figure 3.
CYR61 expression is increased in tumor and serum patient samples in PDAC. (A) Microarray dataset analysis (GDS4103) for CYR61 expression in PDAC tumors. Mann–Whitney test, ***P < 0.0001. n = 39 patient samples. (B) Microarray dataset analysis (GDS4103) for CYR61 expression in PDAC tumors, comparing matched normal adjacent tissue with tumor tissue. Wilcoxon matched pairs signed rank test, ***P < 0.0001. Of 39 tumor samples, 29 had increased CYR61 expression. (C) Microarray dataset analysis (GSE43288) for CYR61 expression in normal pancreas, familial PanIN lesions and PDAC tumors. Kruskal–Wallis test and Dunn’s multiple comparison test, **P = 0.0051 for Normal versus PDAC. n = 3 for normal pancreas, n = 13 for PanIN, n = 4 for PDAC. (D) ELISA was performed on serum samples from healthy volunteers and PDAC patients. Mann–Whitney test, *P = 0.0142. n = 8 healthy volunteer samples, n = 9 PDAC samples. (E) Survival analysis of PDAC patients split by CYR61 expression from RNAseq analysis of the ICGC PACA-AU dataset. P = 0.2389.
Figure 4.
Figure 4.
CYR61 is expressed by stromal PSCs in the tumor microenvironment. (A) CYR61 expression from RNAseq data (29) in fragments per kilobase of transcript per million mapped reads in PDAC samples, PDXs, PSCs and isolated cancer cells cultured in vitro (cancer cell). PDX samples were processed with Xenome to sort human-specific epithelial expression from mouse-specific stromal expression (29). Kruskal–Wallis and Multiple Comparison Test, PDX versus PSCs. ***P < 0.0001, PDX versus PDAC. ***P < 0.0001. n = 15 for PDAC, n = 37 for PDX, n = 6 for PSCs, n = 3 for cancer cells. (B) IHC staining performed for CYR61 and α-SMA on human PDAC tissue using Warp Red Chromagen with hematoxylin counterstain. Arrows point to examples of cells positive for CYR61 and α-SMA. 40× magnification, scale bar is 25 µm (lower right). n = 9 PDAC samples, representative images shown for two samples. (C) Western blot of CYR61 (Santa Cruz) in immortalized human PSC cell lines (HPSC-T and RLT-PSC) and PDAC cell lines (CFPAC, BxPC3, L3.6p, MiaPaCa-2 and PANC1). Lysates were also probed for the mesenchymal marker fibronectin and the epithelial marker E-cadherin. n = 3 independent replicates. (D) Western blot of cleaved caspase 3 for PDAC cell lines treated with ±20 µg/ml gemcitabine for 48h. Results are representative of three independent experiments. (E) Cell Titer Glo assay measuring cell viability of PDAC cell lines in response to a dose course of gemcitabine treatment for 48h. n = 3 independent replicates, each condition performed in triplicate.
Figure 5.
Figure 5.
TGF-β-ALK5-Smad signaling induces CYR61 expression in pancreatic stellate cells. (AC) Linear regression was performed using the microarray dataset GDS4103. n = 39 patient samples: (A) TGFB1, (B) SERPINE1 and (C) SMAD7. (D) Western blot of CYR61 (Abcam) in LTC-14 and imPSC cells that were serum starved in 1% FBS then treated with indicated doses of TGF-β1 for 16h. (E) Western blot of CYR61 (Abcam) in LTC-14 cells that were serum starved in 1% FBS then treated with 100 pM TGF-β for indicated times. (F) Quantitative RT-PCR for rCYR61 performed on LTC-14 cells treated with 100 pM TGF-β for 0, 3 or 6h. ANOVA ***P = 0.0002, Dunnett’s multiple comparison test, 0h versus 3h **P = 0.003, 0h versus 6h ***P = 0.0001. n = 3 replicates. (G) Western blot analyzing downstream TGF-β signaling. LTC-14 cells were serum starved in 1% FBS then treated with 100 pM TGF-β1 ligand for indicated times. (H) Western blot of CYR61 (Abcam) in LTC-14 cells pretreated with DMSO vehicle control or inhibitors against ALK5 (20 μM SB431542), p38 MAPK (10 µM SB203580) or PI3K (10 µM LY294002) for 30min then treated with 100 pM TGF-β1 for 16h. (I) Western blot for CYR61 (Abcam), Smad2 and Smad3 in LTC-14 cells stably expressing NTC or CRISPR constructs against both Smad2 and Smad3. All western blotting results are representative of three independent experiments.
Figure 6.
Figure 6.
Expression of CYR61 and activation of TGF-β signaling in PSCs promote resistance to gemcitabine-induced apoptosis in an in vitro co-culture assay. (A) Model of in vitro co-culture assay examining the effect of TGFβ-induced CYR61 derived from PSCs on gemcitabine-induced apoptosis of PDAC cells. (B) Western blot of CYR61 (Abcam) in LTC-14 cells. LTC-14 cells were infected with CA-ALK5 or luciferase control adenovirus or CYR61 or luciferase control adenovirus at an MOI of 100 for 48h. (C) Western blot of CYR61 (Abcam) in LTC-14 condensed CM following treatment with 100 pM TGF-β1 or infected with CA-ALK5 adenovirus at an MOI of 25 for 48h. (D) Western blot of cleaved caspase 3 in CFPAC cells treated with 10 µg/ml gemcitabine for 48h. CFPAC cells were pretreated for 24h with CM collected from LTC-14 cells or nonconditioned media (non-CM) as a control. CM was collected from LTC-14 cells infected with adenoviruses as indicated in panel B. (E, F) Linear regression using the microarray dataset GDS4103. n = 39 patient samples: (E) hENT1 (SLC29A1) and (F) hCNT3 (SLC28A3). All western blotting results are representative of three independent experiments.

Similar articles

Cited by

References

    1. Siegel R., et al. (2014) Cancer statistics, 2014. CA: A Cancer J. Clin., 64, 9–29. - PubMed
    1. Rahib L., et al. (2014) Projecting cancer incidence and deaths to 2030: the unexpected burden of thyroid, liver, and pancreas cancers in the United States. Cancer Res., 74, 2913–2921. - PubMed
    1. de Sousa Cavalcante L., et al. (2014) Gemcitabine: metabolism and molecular mechanisms of action, sensitivity and chemoresistance in pancreatic cancer. Eur. J. Pharmacol., 741, 8–16. - PubMed
    1. Burris H.A., 3rd, et al. (1997) Improvements in survival and clinical benefit with gemcitabine as first-line therapy for patients with advanced pancreas cancer: a randomized trial. J. Clin. Oncol., 15, 2403–2413. - PubMed
    1. Garrido-Laguna I., et al. (2015) Pancreatic cancer: from state-of-the-art treatments to promising novel therapies. Nat. Rev. Clin. Oncol., 12, 319–334. - PubMed

MeSH terms