

Case Reports
doi: 10.1111/anec.12401.
Epub 2016 Sep 7.
Severe hypocalcemia mimicking ST-segment elevation acute myocardial infarction
Affiliations
- PMID: 27604986
- PMCID: PMC6931885
- DOI: 10.1111/anec.12401
Item in Clipboard
Case Reports
Severe hypocalcemia mimicking ST-segment elevation acute myocardial infarction
Ann Noninvasive Electrocardiol.
2017 Mar.
Abstract
Hypocalcemia is mainly the consequence of hypoalbuminemia, advanced renal impairment, cirrhosis, malnutrition, or sepsis. The most common ECG manifestation of hypocalcemia is QT prolongation as a result of ST segment lengthening. Very occasionally, hypocalcemia can manifest with ST segment elevation forcing the differential diagnosis with ST elevation MI. We described a case of severe hypocalcemia manifesting in electrocardiogram with a J point elevation, absent of ST segment and with associated short QT interval mimicking acute myocardial infarction.
Keywords: QT interval; hypercalcemia; electrocardiogram.
© 2016 Wiley Periodicals, Inc.
Figures
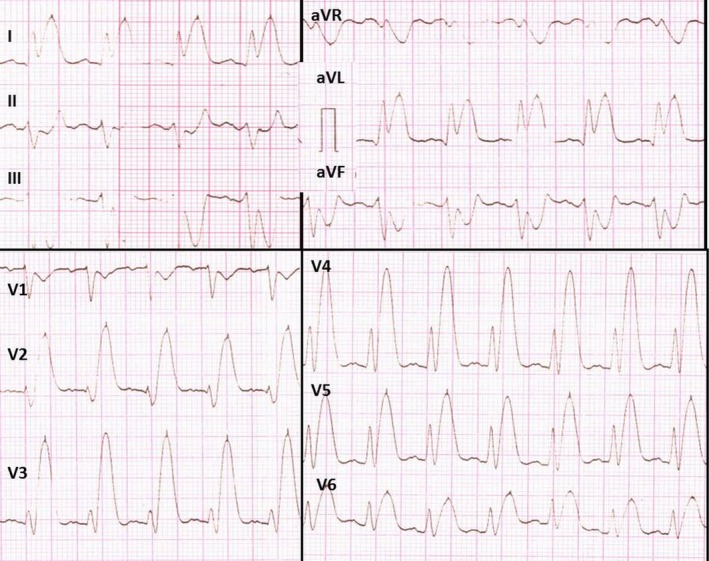
Electrocardiogram on hospital admission. Surface 12‐lead ECG on admission depicted sinus rhythm at 115–120 bpm. P‐wave abnormalities (P “mitrale”‐ bifid P wave in inferior leads II , III , aVF and leads V2–V6), PQ interval 160 ms, QRS duration of 90 ms, QT interval of 240 ms (limb leads), QT c interval – 320 ms, QT interval 280 ms (precordial leads), QT
apex – 160–180 ms, corrected QT
apex – 221 ms. J point elevation in lateral leads (I and aVL ) with mirror J point depression in leads (II , III and aVF ), absent ST segment and tall peaked T waves
Similar articles
-
Severe hypocalcemia mimicking acute ST-segment elevation myocardial infarction: Paradigmatic case and review of literature.Cardiol J. 2022;29(4):710-713. doi: 10.5603/CJ.a2022.0048. Epub 2022 May 27. Cardiol J. 2022. PMID: 35621088 Free PMC article. Review. No abstract available.
-
New electrocardiographic criteria to differentiate acute pericarditis and myocardial infarction.Am J Med. 2014 Mar;127(3):233-9. doi: 10.1016/j.amjmed.2013.11.006. Epub 2013 Nov 25. Am J Med. 2014. PMID: 24287008
-
Severe hypocalcemia simulating ST-elevation myocardial infarction.Am J Emerg Med. 2012 Jan;30(1):256.e3-6. doi: 10.1016/j.ajem.2010.10.021. Epub 2010 Dec 3. Am J Emerg Med. 2012. PMID: 21129889
-
Electrocardiogram mimics of acute ST-segment elevation myocardial infarction: insights from cardiac magnetic resonance imaging in patients with tako-tsubo (stress) cardiomyopathy.J Electrocardiol. 2008 Nov-Dec;41(6):621-5. doi: 10.1016/j.jelectrocard.2008.06.015. Epub 2008 Sep 13. J Electrocardiol. 2008. PMID: 18790504
-
Update on ACC/ESC criteria for acute ST-elevation myocardial infarction.Anadolu Kardiyol Derg. 2007 Jul;7 Suppl 1:14-5. Anadolu Kardiyol Derg. 2007. PMID: 17584670 Review.
Cited by
-
Severe hypocalcemia mimicking acute ST-segment elevation myocardial infarction: Paradigmatic case and review of literature.Cardiol J. 2022;29(4):710-713. doi: 10.5603/CJ.a2022.0048. Epub 2022 May 27. Cardiol J. 2022. PMID: 35621088 Free PMC article. Review. No abstract available.
-
ST-Segment Elevation in Conditions of Non-cardiovascular Origin Mimicking an Acute Myocardial Infarction: A Narrative Review.Cureus. 2022 Oct 30;14(10):e30868. doi: 10.7759/cureus.30868. eCollection 2022 Oct. Cureus. 2022. PMID: 36465741 Free PMC article. Review.
References
-
- Dalamaga, M. , Karmaniolas, K. , Nikolaidou, A. , & Papadavid, E. (2008). Hypocalcemia, hypomagnesemia, and hypokalemia following hydrofluoric acid chemical injury. Journal of Burn Care & Research, 29, 541–543. - PubMed
-
- Greco, R. J. , Hartford, C. E. , Haith Jr, L. R. , & Patton, M. L. (1988). Hydrofluoric acid‐induced hypocalcemia. Journal of Trauma, 28, 1593–1596. - PubMed
-
- Khardori, R. , Cohen, B. , Taylor, D. , Soler, N.G. (1985). Electrocardiographic findings simulating acute myocardial infarction in a compound metabolic aberration. American Journal of Medicine, 78(3), 529–532. - PubMed
-
- Nierenberg, D. W. , & Ransil, B. J. (1979). Q‐aTc interval as a clinical indicator of hypercalcemia. American Journal of Cardiology, 44(2), 243–248. - PubMed
Publication types
MeSH terms
LinkOut - more resources
Full Text Sources
Other Literature Sources
Medical
