. 2016 Oct 15;197(8):3099-3110.
doi: 10.4049/jimmunol.1501628. Epub 2016 Sep 7.

Sodium Benzoate, a Food Additive and a Metabolite of Cinnamon, Enriches Regulatory T Cells via STAT6-Mediated Upregulation of TGF-β

Affiliations

Sodium Benzoate, a Food Additive and a Metabolite of Cinnamon, Enriches Regulatory T Cells via STAT6-Mediated Upregulation of TGF-β

Madhuchhanda Kundu et al. J Immunol. .

Abstract

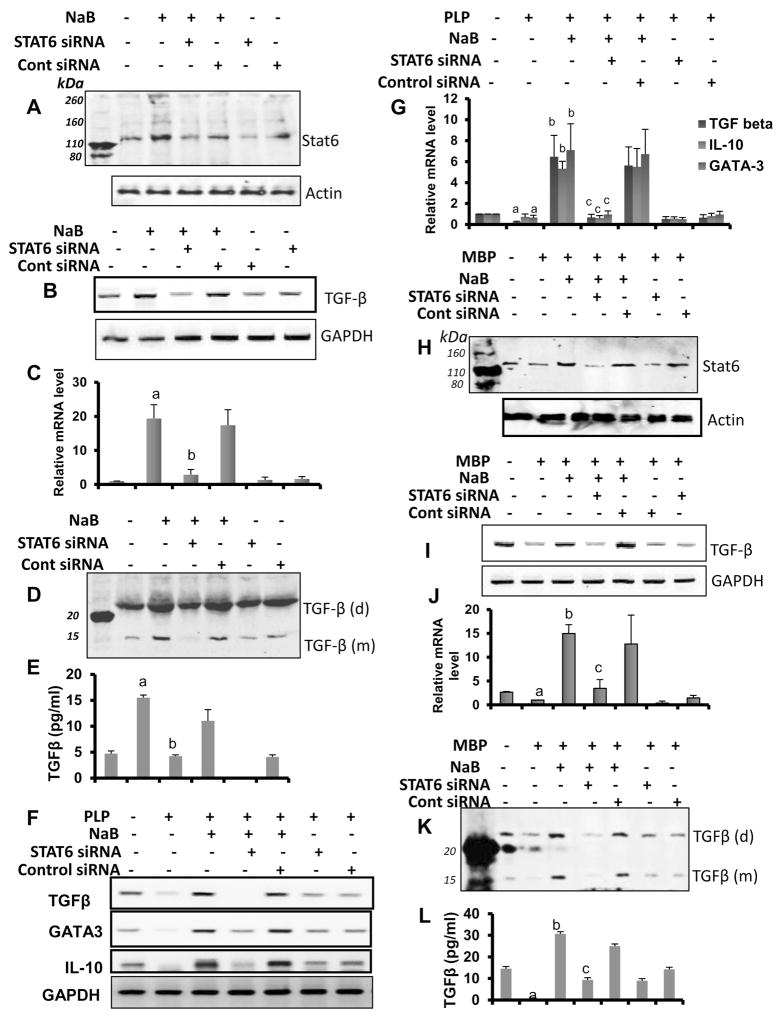
Upregulation and/or maintenance of regulatory T cells (Tregs) during autoimmune insults may have therapeutic efficacy in autoimmune diseases. Earlier we have reported that sodium benzoate (NaB), a metabolite of cinnamon and a Food and Drug Administration-approved drug against urea cycle disorders, upregulates Tregs and protects mice from experimental allergic encephalomyelitis, an animal model of multiple sclerosis. However, mechanisms by which NaB increases Tregs are poorly understood. Because TGF-β is an important inducer of Tregs, we examined the effect of NaB on the status of TGF-β. In this study, we demonstrated that NaB induced the expression of TGF-β mRNA and protein in normal as well as proteolipid protein-primed splenocytes. The presence of a consensus STAT6 binding site in the promoter of the TGF-β gene, activation of STAT6 in splenocytes by NaB, recruitment of STAT6 to the TGF-β promoter by NaB, and abrogation of NaB-induced expression of TGF-β in splenocytes by small interfering RNA knockdown of STAT6 suggest that NaB induces the expression of TGF-β via activation of STAT6. Furthermore, we demonstrated that blocking of TGF-β by neutralizing Abs abrogated NaB-mediated protection of Tregs and experimental allergic encephalomyelitis. These studies identify a new function of NaB in upregulating TGF-β via activation of STAT6, which may be beneficial in MS patients.


Figures

Figure 1
Figure 1. Enrichment of Tregs by NaB in PLP-primed splenocytes
A) Splenocytes isolated from PLP-TCR transgenic (Tg) mice were stimulated with PLP in the presence of either NaB (200 μM) or sodium formate (NaFO) for 24 h followed by FACS analysis using appropriately diluted PE-conjugated anti-Foxp3 and FITC-conjugated anti-CD4 Abs. During analysis, first we gated the T lymphocytes from total population and then we set a gate for CD4 population. From that, the percentage of Foxp3-positive cells was determined. Cells were also analyzed by FACS analysis using appropriately diluted PE-conjugated anti-CD62L & FITC-conjugated anti-CD4 Abs (B) and PE-conjugated anti-CD73 & FITC-conjugated anti-CD4 Abs (C). The MFIs of CD62L (D) and CD73 (E) in CD4+ population were calculated by using CellQuest software. Data are mean ± SD of three different experiments. ap < 0.001 vs control; bp < 0.001 vs PLP.
Figure 2
Figure 2. Upregulation of TGFβ by NaB in PLP-primed splenocytes and in vivo in the spleen of EAE mice
A) Splenocytes isolated from PLP-TCR transgenic (Tg) mice were stimulated with PLP in the presence of different concentrations of NaB for 24 h followed by measuring level of TGFβ in supernatant by ELISA. B) Splenocytes were stimulated with PLP in the presence of 200 μM NaB for different time periods followed by measuring level of TGFβ in supernatant by ELISA. Results are mean ± SD of three different experiments. ap < 0.001 vs control; bp < 0.001 vs PLP. C) Splenocytes were stimulated with PLP in the presence of different concentrations of NaB for 24 h followed by monitoring the protein level of TGFβ in cells by Western blot. D) Bands were scanned and expressed as relative to control. ap < 0.01 vs control; bp < 0.01 vs PLP. E) PLP-TCR Tg mice were immunized with PLP (10 μg/mouse) and mice were treated with either NaB or NaFO at a dose of 100 mg/kg body wt/d via gavage from 4 days post-immunization (dpi) (the onset of acute phase) until 12 dpi (acute phase) followed by monitoring the level of TGFβ in splenic sections by double-label immunofluorescence (Iba1, red; TGFβ, green). Results represent analysis of three splenic sections of each of four mice (n=4) per group.
Figure 3
Figure 3. Upregulation of TGFβ by NaB in normal splenocytes
Splenocytes isolated from female SJL/J mice were treated with different concentrations of NaB for 6 h followed by monitoring the mRNA expression of TGFβ by semi-quantitative RT-PCR (A) and real-time PCR (B). Results are mean ± SD of three different experiments. ap < 0.01 vs control: bp < 0.001 vs control. After 24 h of treatment, the level of TGFβ protein was examined in cell homogenates by Western blot (C). Bands were scanned and expressed as relative to control (D). Results are mean ± SD of three different experiments. ap < 0.001 vs control; bp < 0.05 vs control. Splenocytes were treated with 200 μM NaB for different time periods followed by monitoring the mRNA expression of TGFβ by semi-quantitative RT-PCR (E) and real-time PCR (F). Results are mean ± SD of three different experiments. ap < 0.001 vs control. G) Splenocytes were treated with 200 μM NaB for 24 h followed by monitoring TGFβ by double-label immunofluorescence (Iba1, green; TGFβ, red). H) Iba1+TGFβ+ and Iba1-TGFβ+ cells were counted in an Olympus IX81 fluorescence microscope using the MicroSuite imaging software. Three images from each experiment were used for counting. Results are mean ± SD of three independent experiments. ap < 0.001 vs control.
Figure 4
Figure 4. NaB treatment results in the activation of STAT6 and the recruitment of STAT6 to the Tgfb promoter
(A) Position of STAT6-binding site is shown in the Tgfb gene promoter. B) Splenocytes isolated from female SJL/J mice were treated with 200 μM NaB for different minute intervals followed by monitoring the level of phospho-STAT6 and total STAT6 in cell extracts by Western blot. NaFO was run as a negative control for NaB. C) Bands were scanned and expressed as relative to control. Results are mean ± SD of three different experiments. ap < 0.05 vs control; bp < 0.001 vs control. (D) Cells were treated with 200 μM NaB for different minute intervals followed by monitoring the level of STAT6 and STAT1 in nuclear extracts by Western blot. Histone 3 (H3) was run as a marker for nuclear extracts. E) Bands were scanned and expressed as relative to control. Results are mean ± SD of three different experiments. ap < 0.001 vs control. F) Cells were treated with NaB and NaFO for 3 h followed by monitoring the recruitment of STAT6 in TGF-β gene promoter by ChIP analysis. G) Results were confirmed by real-time PCR. Results are mean ± SD of three different experiments. ap < 0.001 vs control.
Figure 5
Figure 5. SiRNA knockdown of STAT6 suppresses NaB-mediated increase in TGFβ in normal as well as neuroantigen-primed splenocytes
(A) Splenocytes isolated from female SJL/J mice were treated with control and STAT6 siRNA for 24 h followed by stimulation with NaB. After 24 h, the level of STAT6 protein was monitored by Western blot. B) After 6 h of NaB treatment, the mRNA expression of TGFβ was monitored by semi-quantitative RT-PCR (B) and real-time PCR (C). Results are mean ± SD of three different experiments. ap < 0.001 vs control; bp < 0.001 vs NaB. After 24 h of NaB treatment, the level of TGF-β protein was monitored by Western blot in cells (D) and by ELISA in supernatants (E). Results are mean ± SD of three different experiments. ap < 0.001 vs control; bp < 0.001 vs NaB. Splenocytes isolated from female PLP-TCR Tg mice were challenged with PLP and treated with control and STAT6 siRNA. After 24 h, cells were stimulated with NaB for 6 h followed by monitoring the mRNA expression of TGFβ, GATA3 and IL-10 by semi-quantitative RT-PCR (F) and real-time PCR (G). Results are mean ± SD of three different experiments. ap < 0.01 vs control; bp < 0.001 vs PLP; cp < 0.001 vs NaB. Splenocytes isolated from MBP-immunized female SJL/J mice were challenged with MBP and treated with immunized with MBP and treated with control and STAT6 siRNA. After 24 h, cells were stimulated with NaB for 24 h followed by monitoring the protein level of STAT6 (H) by Western blot. After 6 h of NaB treatment, the mRNA expression of TGFβ was monitored by semi-quantitative RT-PCR (I) and real-time PCR (J). After 24 h, TGFβ protein was monitored in cells by Western blot (K) and in supernatant by ELISA (L). Results are mean ± SD of three different experiments. ap < 0.001 vs control; bp < 0.001 vs MBP; cp < 0.001 vs NaB.
Figure 6
Figure 6. NaB upregulates Tregs in PLP-primed splenocytes via TGFβ
Splenocytes isolated from female PLP-TCR Tg mice were treated with PLP and NaB in the presence of different concentrations of TGFβ neutralizing antibodies. After 24 h of treatment, the mRNA expression of Foxp3, CD62L, CD73, CD25, and CD4 was monitored by semi-quantitative RT-PCR (A) and real-time PCR (B). Results are mean ± SD of three different experiments. ap < 0.001 vs control; bp < 0.001 vs PLP; cp < 0.001 vs NaB. (C) Cells were also analyzed by FACS analysis using appropriately diluted PE-conjugated anti-Foxp3 and FITC-conjugated anti-CD4 Abs. D) The MFI of Foxp3 in CD4+ population was calculated by using CellQuest software. Data are mean ± SD of three different experiments. ap < 0.001 vs control; bp < 0.001 vs PLP; cp < 0.001 vs NaB.
Figure 7
Figure 7. NaB treatment upregulates Tregs in mice with EAE via TGFβ
Female PLP-TCR Tg mice were immunized with PLP and mice were treated with NaB in the presence or absence of TGFβ neutralizing antibody (30 μg /mouse) from 4 dpi. One group of mice also received same amount of control IgG. On 12 dpi, splenocytes isolated from all groups of mice were analyzed by FACS for Foxp3 and CD4 (A). The MFI of Foxp3 in CD4+ population was calculated by using CellQuest software (B). Data are mean ± SEM of three mice per group. ap < 0.05 vs control; bp < 0.001 vs PLP; cp < 0.001 vs NaB. C) Splenic sections were double-labeled for Foxp3 (red) and CD3 (green). Results represent analysis of three splenic sections of each of three mice (n=3) per group.
Figure 8
Figure 8. NaB treatment suppresses Th17 cells in mice with EAE via TGFβ
Female PLP-TCR Tg mice were immunized with PLP and mice were treated with NaB in the presence or absence of TGFβ neutralizing antibody (30 μg /mouse) from 4 dpi. One group of mice also received same amount of control IgG. On 12 dpi, splenocytes isolated from all groups of mice were analyzed by FACS for IL-17 and CD4 (A). The MFI of IL-17 in CD4+ population was calculated by using CellQuest software (B). Data are mean ± SEM of three mice per group. ap < 0.001 vs control; bp < 0.001 vs PLP; cp < 0.001 vs NaB.
Figure 9
Figure 9. Oral administration of NaB protects mice from EAE via TGFβ
A) Female PLP-TCR Tg mice were immunized with PLP and from 4 dpi, mice were treated with NaB (100 mg/kg of body weight/d) via gavage followed by one i.p. injection of anti-TGFβ antibody (30 μg/mouse) on the same day. One group of mice also received same amount of control IgG. Mice (n=6) were examined for clinical symptoms daily until 36 dpi. B) EAE was induced in female SJL/J mice by adoptive transfer of MBP-primed T cells and from 4 dpt, mice were treated with NaB (100 mg/kg of body weight/d) via gavage followed by one i.p. injection of anti-TGFβ. Mice (n=6) were examined for clinical symptoms daily until 21 dpt.

Similar articles

Cited by

References

    1. Coffer PJ, Burgering BM. Forkhead-box transcription factors and their role in the immune system. Nat Rev Immunol. 2004;4:889–899. - PubMed
    1. Hori S, Nomura T, Sakaguchi S. Control of regulatory T cell development by the transcription factor Foxp3. Science. 2003;299:1057–1061. - PubMed
    1. Kleinewietfeld M, Hafler DA. Regulatory T cells in autoimmune neuroinflammation. Immunol Rev. 2014;259:231–244. - PMC - PubMed
    1. Sakaguchi S. Naturally arising Foxp3-expressing CD25+CD4+ regulatory T cells in immunological tolerance to self and non-self. Nat Immunol. 2005;6:345–352. - PubMed
    1. Venken K, Hellings N, Thewissen M, Somers V, Hensen K, Rummens JL, Medaer R, Hupperts R, Stinissen P. Compromised CD4+ CD25(high) regulatory T-cell function in patients with relapsing-remitting multiple sclerosis is correlated with a reduced frequency of FOXP3-positive cells and reduced FOXP3 expression at the single-cell level. Immunology. 2008;123:79–89. - PMC - PubMed

Publication types

MeSH terms