. 2016 Sep;13(122):20160414.
doi: 10.1098/rsif.2016.0414.

Crowd behaviour during high-stress evacuations in an immersive virtual environment

Affiliations

Crowd behaviour during high-stress evacuations in an immersive virtual environment

Mehdi Moussaïd et al. J R Soc Interface. 2016 Sep.

Abstract

Understanding the collective dynamics of crowd movements during stressful emergency situations is central to reducing the risk of deadly crowd disasters. Yet, their systematic experimental study remains a challenging open problem due to ethical and methodological constraints. In this paper, we demonstrate the viability of shared three-dimensional virtual environments as an experimental platform for conducting crowd experiments with real people. In particular, we show that crowds of real human subjects moving and interacting in an immersive three-dimensional virtual environment exhibit typical patterns of real crowds as observed in real-life crowded situations. These include the manifestation of social conventions and the emergence of self-organized patterns during egress scenarios. High-stress evacuation experiments conducted in this virtual environment reveal movements characterized by mass herding and dangerous overcrowding as they occur in crowd disasters. We describe the behavioural mechanisms at play under such extreme conditions and identify critical zones where overcrowding may occur. Furthermore, we show that herding spontaneously emerges from a density effect without the need to assume an increase of the individual tendency to imitate peers. Our experiments reveal the promise of immersive virtual environments as an ethical, cost-efficient, yet accurate platform for exploring crowd behaviour in high-risk situations with real human subjects.

Keywords: collective behaviour; self-organization; social systems; virtual laboratory.


Figures

Figure 1.
Figure 1.
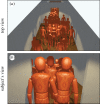
Illustration of the virtual environment. (a) Top-down view of a crowd of 36 participants passing through a bottleneck during a simple evacuation situation. Each pedestrian in this snapshot was controlled by a real experimental participant who can navigate freely in the environment. (b) First-person view of the same situation as seen by one participant located in the middle of the crowd.
Figure 2.
Figure 2.
Comparison of virtual and real results during simple avoidance manoeuvres [41,42]. (a) Average lateral deviation of the walking trajectories during a simple avoidance task for which two participants moving in opposite directions avoid each other in a narrow corridor (real-life experiment in blue, N = 144; virtual environment in red, N = 561). Error bars indicate the standard deviation of the mean. (b) Proportion of participants avoiding each other on the right-hand sides during the same experiments.
Figure 3.
Figure 3.
Flow through a bottleneck in real and virtual environment. (a) Flow of people through bottlenecks of varying width, measured during a group evacuation experiment in our virtual environment (red dots), replicating real-life experiments (blue dots). Lines of best fit are f(x) = 1.29x + 0.45 and f(x) = 1.04x + 0.27 for the real-life and virtual environments, respectively. (b) Net flow per unit of door width in the virtual environment (in red) and for study [42] (in blue). Error bars indicate the standard deviation of the mean. The three black dashed lines show the average values reported in three other real-life studies [9,43,44].
Figure 4.
Figure 4.
Comparison between low-stress and high-stress escape experiments. (a) Illustrative snapshots of the environment as seen by one participant approaching the decision zone in the low-stress (top) and high-stress (bottom) conditions. In addition to time pressure and the risk of losing money, the high-stress environment is characterized by stress-inducing factors such as lower luminosity and red blinking lights. (b) Representative top-down views of the participants' positions in both conditions. Under low stress, participants kept a certain distance from each other and tended to explore both branches of the main corridor. Under high stress, participants were densely packed and herded in the same branch. For each replication, the free exit door was randomly placed at one location among E1, E2, E3 and E4. In both examples illustrated here, the exit door was located at position E2. (c) Maximum density levels measured all over the environment, averaged across all replications (Nlow-stress = 10 and Nhigh-stress = 12). Density levels hardly approach 2 persons m−2 in low-stress conditions, but reached up to 5 persons m−2 under high-stress—a very high value at which physical injuries might occur.
Figure 5.
Figure 5.
Herding dynamics. (a) Individual probabilities to choose the right-hand branch when arriving in the decision zone as a function of the social signal produced by the crowd at that moment. A positive signal indicates crowd movements directed towards the right side (a negative one, respectively, towards the left side). The left and right panels correspond to the low-stress and high-stress conditions, respectively. The response function was almost identical in both conditions, indicating that the observed herding patterns do not result from a change in the herding tendency but instead from the crowdedness. The fitted curves were obtained by minimization of the squared distance to the data points using the equation 1/(1 + eaS+b), resulting in a = −0.59 and b = 0.03 under no stress and a = −0.66 and b = 0.80 under high stress. (b) Average herding level H(t) indicating the fraction of uninformed individuals who chose the same branch as the majority of individuals, under low-stress (blue) and high-stress (red) conditions. The dashed lines represent the standard deviation of the average. Herding is stronger under high stress than under low stress (also illustrated in figure 4b), despite a similar individual response function shown in (a). (c) The distribution of the social signal strength shows that the social signal is weaker under low stress (blue) than under high stress (red).

Comment in

  • Fires: fund research for citizen safety.
    Boustras G, Ronchi E, Rein G. Boustras G, et al. Nature. 2017 Nov 16;551(7680):300. doi: 10.1038/d41586-017-06020-6. Nature. 2017. PMID: 29144471 No abstract available.

References

    1. Moussaïd M, Helbing D, Theraulaz G. 2011. How simple rules determine pedestrian behavior and crowd disasters. Proc. Natl Acad. Sci. USA 108, 6884–6888. (10.1073/pnas.1016507108) - DOI - PMC - PubMed
    1. Helbing D, Farkas I, Vicsek T. 2000. Simulating dynamical features of escape panic. Nature 407, 487–490. (10.1038/35035023) - DOI - PubMed
    1. Alnabulsi H, Drury J. 2014. Social identification moderates the effect of crowd density on safety at the Hajj. Proc. Natl Acad. Sci. USA 111, 9091–9096. (10.1073/pnas.1404953111) - DOI - PMC - PubMed
    1. Schadschneider A, et al. 2009. Evacuation dynamics: empirical results, modeling and applications. In Encyclopedia of complexity and systems science, pp. 3142–3176. New York, NY: Springer.
    1. Couzin I, Krause J. 2003. Self-organization and collective behavior in vertebrates. Adv. Stud. Behav. 32, 1–75. (10.1016/S0065-3454(03)01001-5) - DOI

Publication types

LinkOut - more resources