. 2013 Apr 3;2(2):63-80.
doi: 10.3390/microarrays2020063.

Phenotypic MicroRNA Microarrays

Affiliations

Phenotypic MicroRNA Microarrays

Yong-Jun Kwon et al. Microarrays (Basel). .

Abstract

Microarray technology has become a very popular approach in cases where multiple experiments need to be conducted repeatedly or done with a variety of samples. In our lab, we are applying our high density spots microarray approach to microscopy visualization of the effects of transiently introduced siRNA or cDNA on cellular morphology or phenotype. In this publication, we are discussing the possibility of using this micro-scale high throughput process to study the role of microRNAs in the biology of selected cellular models. After reverse-transfection of microRNAs and siRNA, the cellular phenotype generated by microRNAs regulated NF-κB expression comparably to the siRNA. The ability to print microRNA molecules for reverse transfection into cells is opening up the wide horizon for the phenotypic high content screening of microRNA libraries using cellular disease models.

Keywords: microRNA; phenotypic screen; siRNA.


Figures

Figure 1
Figure 1
Direct transfection of Hela cells with RelA siRNA. Hela cells were transfected with RelA targeted siRNA vs. scramble siRNA for 48 h. (a) The level of RelA mRNA was measured by qPCR after transfection of anti-p65 siRNA and incubation for 48 h. (b) Cells transfected with anti-p65 siRNA were stained with anti-RelA antibody (Green) and DRAQ5 for nuclei detection (white (nucleus)). The exposure for the representative cell images for this figure was increased to show the presence of the cells in the images where the signal would be too low. (c) Image analysis used MDS MetaMorph image analysis software. The total level of RelA signal was analyzed as described in Section 2.3. The resulted data are presented as % of expressing cells (RelA positive cells). Data are plotted as bar-graphs using GraphPad Prism software, the error-bar representing the standard deviation for n = 3 replicates.
Figure 2
Figure 2
Comparison of NF-κB expression modulated by siRNA and miRNA-373c, miRNA-520 transfection. Hela cells were transfected with 20 nM of scramble siRNA and anti-RelA SiRNA, and the negative control (NC) for microRNA, miR-373c and miR-520 and incubated for 48 h before harvesting and analyzing the level of endogenous p65 by real-time PCR.
Figure 3
Figure 3
NF-κB expression was modulated by miRNA-373c and miRNA-520 transfection. Hela cells were transfected with negative control (NC), miR-373c and miR-520 and incubated for 48 h before fixation and image analysis. (a) Cells were stained with anti-RelA antibody (Green) and DRAQ5 for nuclei detection (white (nucleus)). As for the figure above, the exposure for cell images was increased to show the presence of the cells in the images where the signal would be too low. (b) Image analysis was carried out using MDS MetaXpress image analysis software. The RelA signal analysis is described in Section 2.3 and was presented as % of expressing cells (or % RelA-expressing cells). Data were plotted as bar-graphs using GraphPad Prism software, the error-bar representing the standard deviation for n = 3 replicates.
Figure 4
Figure 4
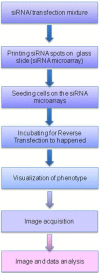
The flow chart for reverse-transfection of RNAi into cell monolayers on microarrays.
Figure 5
Figure 5
Spotting of siRNA on microarrays. Mixture of siRNA, siGLO (red) and transfection reagents described in Table 1 were printed on PLL-coated slides. The red is the detection of siGLO-RED siRNA tracer at the 560 nm channel for visualization of the printed spots. Cells were stained with an anti-RelA/secondary antibody labeled with Alexa 488 (green), detected at 488 nm channel, and DRAQ5 (blue), measured at 635 nm for nuclei detection. (a,c) Containing non-targeting siRNA; (b) anti-RelA siRNA; the reduction of green immuno-staining signals indicates the decrease of NF-κB protein expression in cells.
Figure 6
Figure 6
High density spot siRNA microarray. The tissue culture glass with siGLO siRNA tracer (red) spots visualized at 561 nm to assess the quality of the array printing.
Figure 7
Figure 7
Optimization of the transfection reagent composition for miRNA array. (a) The immunostaining for RelA with Alexa 488 in Hela cells on small-scale siRNA microarrays containing miR-373 and non-targeted miRNA (NC, negative control) printed on MAS-coated glass slide with a matrix titration of different components of the transfection reagent mixture: sucrose from 50–125 mM (vertical) and gelatin from 0.03–0.25% (horizontal). (b) Annotation for the images of the cells representing three channels: siGLO-560 nm (Red), for spot localization; Nuclei-635nm (Blue), DRAQ5 signal; RelA-488 nm (Green). The overlay is the image created by merging all three images together.
Figure 8
Figure 8
Optimization of the conditions for miRNA microarrays. (a) Test of different concentrations of miR-373 (373 miRNA) and non-targeted negative control in microarray. Data is plotted by GraphPad Prism, n = 4. (b) The time course for incubation, 48 and 72 h, of the cells on microarray. Data is plotted by GraphPad Prism; error bar: S.D., n = 4. All images of cells in experiments (a) and (b) were processed as described in Section 2.6.
Figure 9
Figure 9
miRNA high density spots microarray. (a) The array of miRNA (miR-373 and miR-520 and non-coding control) spots used for phenotypic assay and quantitative image analysis: each test (square) shows three images from three channels (red: spots; green: RelA signal; blue: nuclei) and one overlay/merge of those three images (see annotation for Figure 6(b)). (b) The bar-graph plot of the data from images normalized as described in methods and presenting the % of cells expressing a detectable level of NF-κB. The data shows the average % of cells expressing RelA, n = 4; error: S.D. In a Student’s t test, the difference between the control and each of the miRNAs is significant, with p < 0.0001. (c) The array of siRNA (anti-RelA and scramble non-targetd control) spots for phenotypic assay and quantitative image analysis. (d) The bar-graph plot of the data from images for siRNA spots. t test: p < 0.0001.

References

    1. Fire A. RNA-triggered gene silencing. Trend Genet. 1999;15:358–363. doi: 10.1016/S0168-9525(99)01818-1. - DOI - PubMed
    1. Sharp P.A. RNA interference—2001. Genes Dev. 2001;15:485–490. doi: 10.1101/gad.880001. - DOI - PubMed
    1. Elbashir S.M., Harborth J., Lendeckel W., Yalch A., Weber K., Tuschl T. Duplex of 21-nucleotide RNAs mediates RNA interference in cultured mammalian cells. Nature. 2001;411:494–498. - PubMed
    1. Wianny F., Zrnicka-Goetz M. Specific interference with gene function by double-stranded RNA in early mouse development. Nature Cell Biol. 2000;2:70–75. doi: 10.1038/35000016. - DOI - PubMed
    1. Sharma S., Rao A. RNAi screening: Tips and techniques. Nat. Immunol. 2009;10:799–804. doi: 10.1038/ni0809-799. - DOI - PMC - PubMed

LinkOut - more resources