. 2013 Nov 6;2(4):284-303.
doi: 10.3390/microarrays2040284.

Copy Number Studies in Noisy Samples

Affiliations

Copy Number Studies in Noisy Samples

Philip Ginsbach et al. Microarrays (Basel). .

Abstract

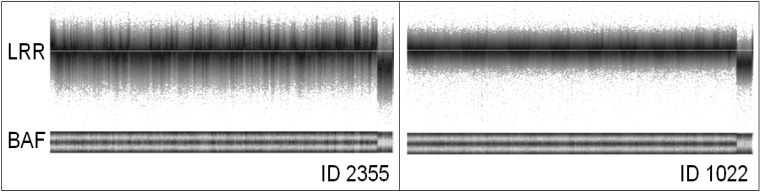
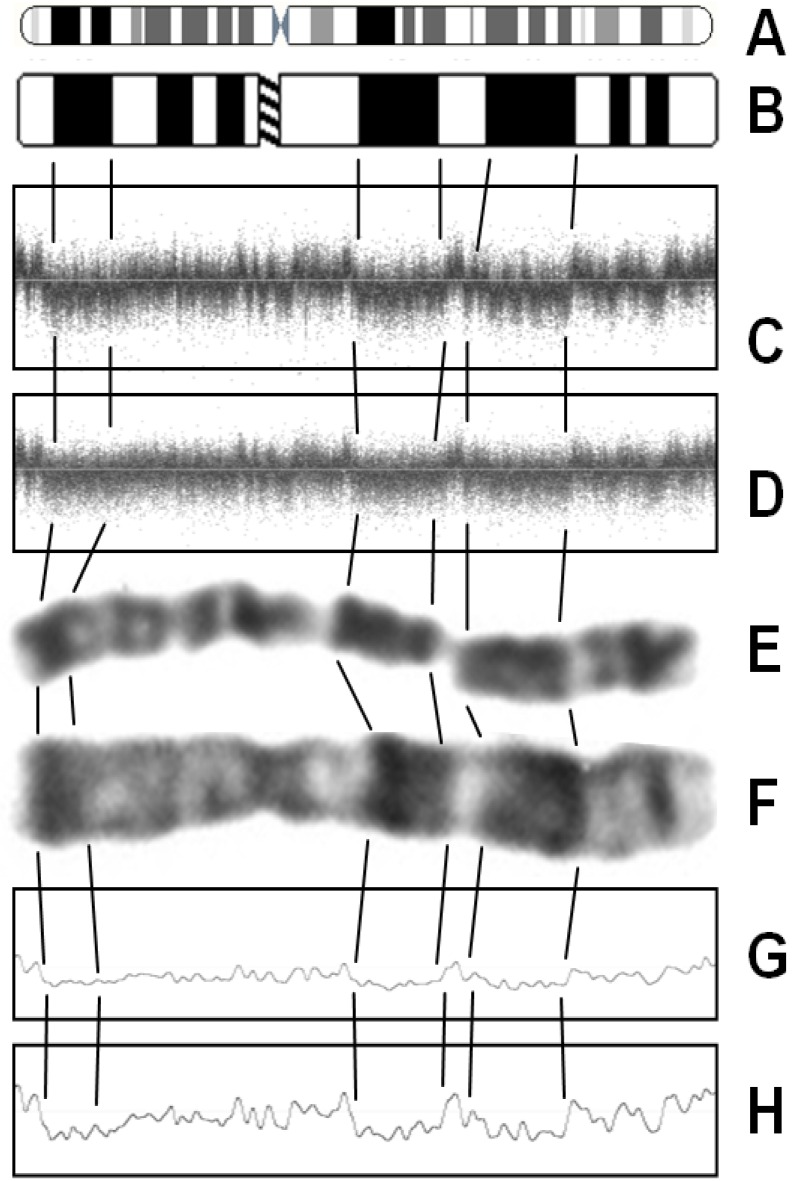
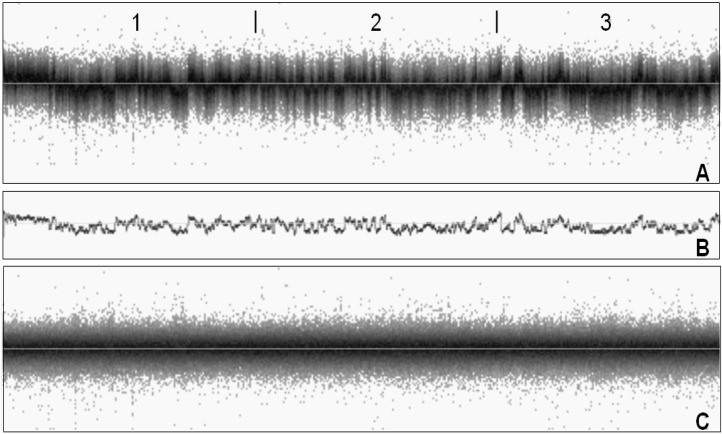
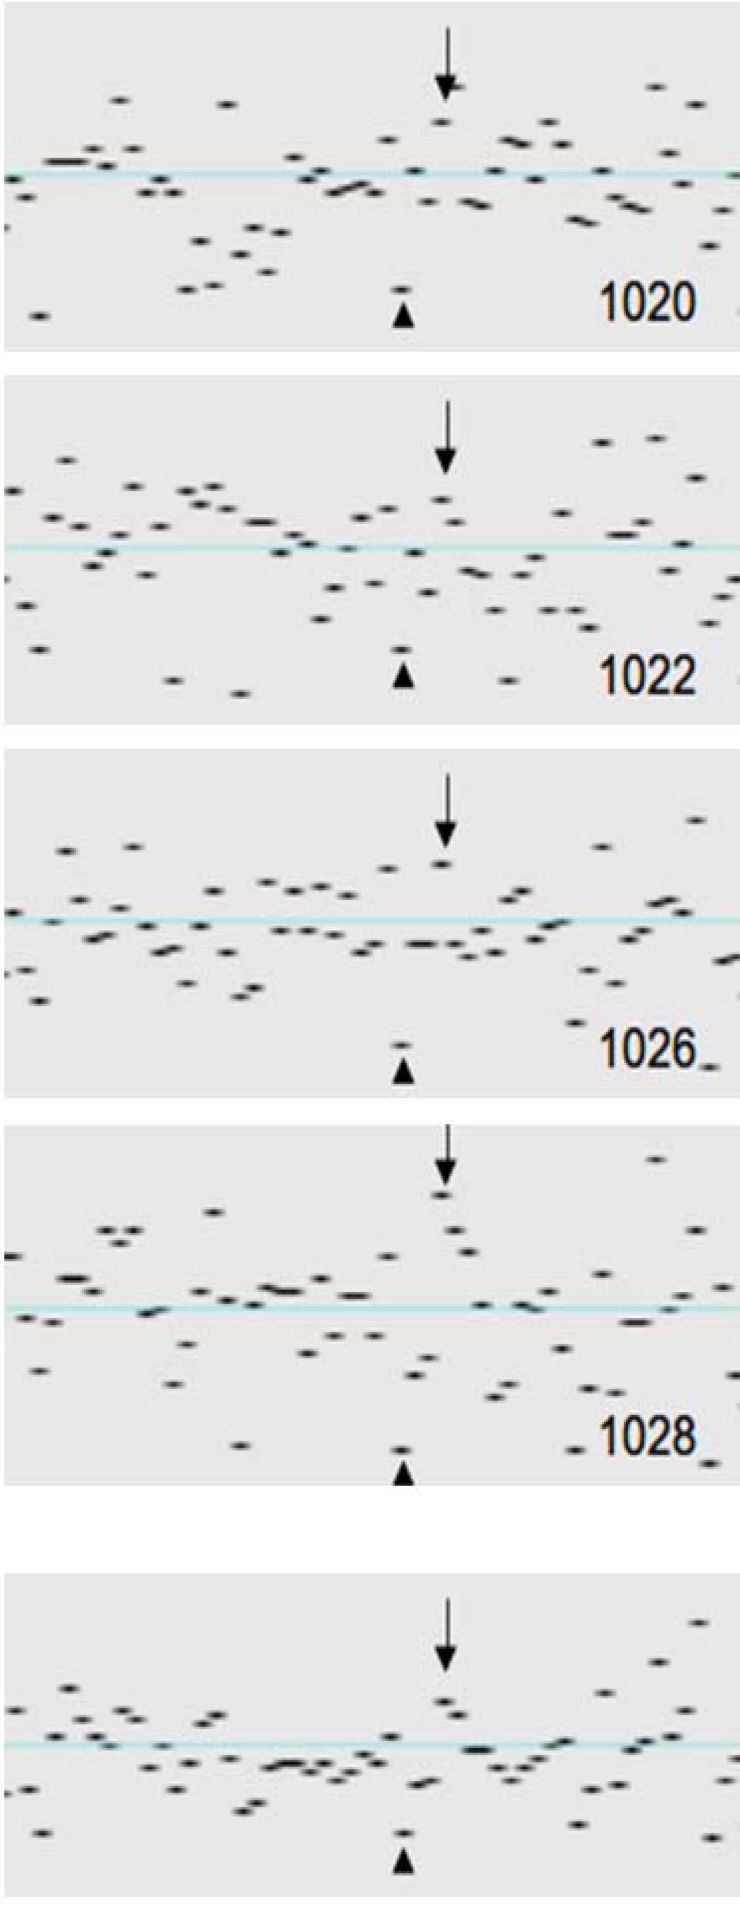
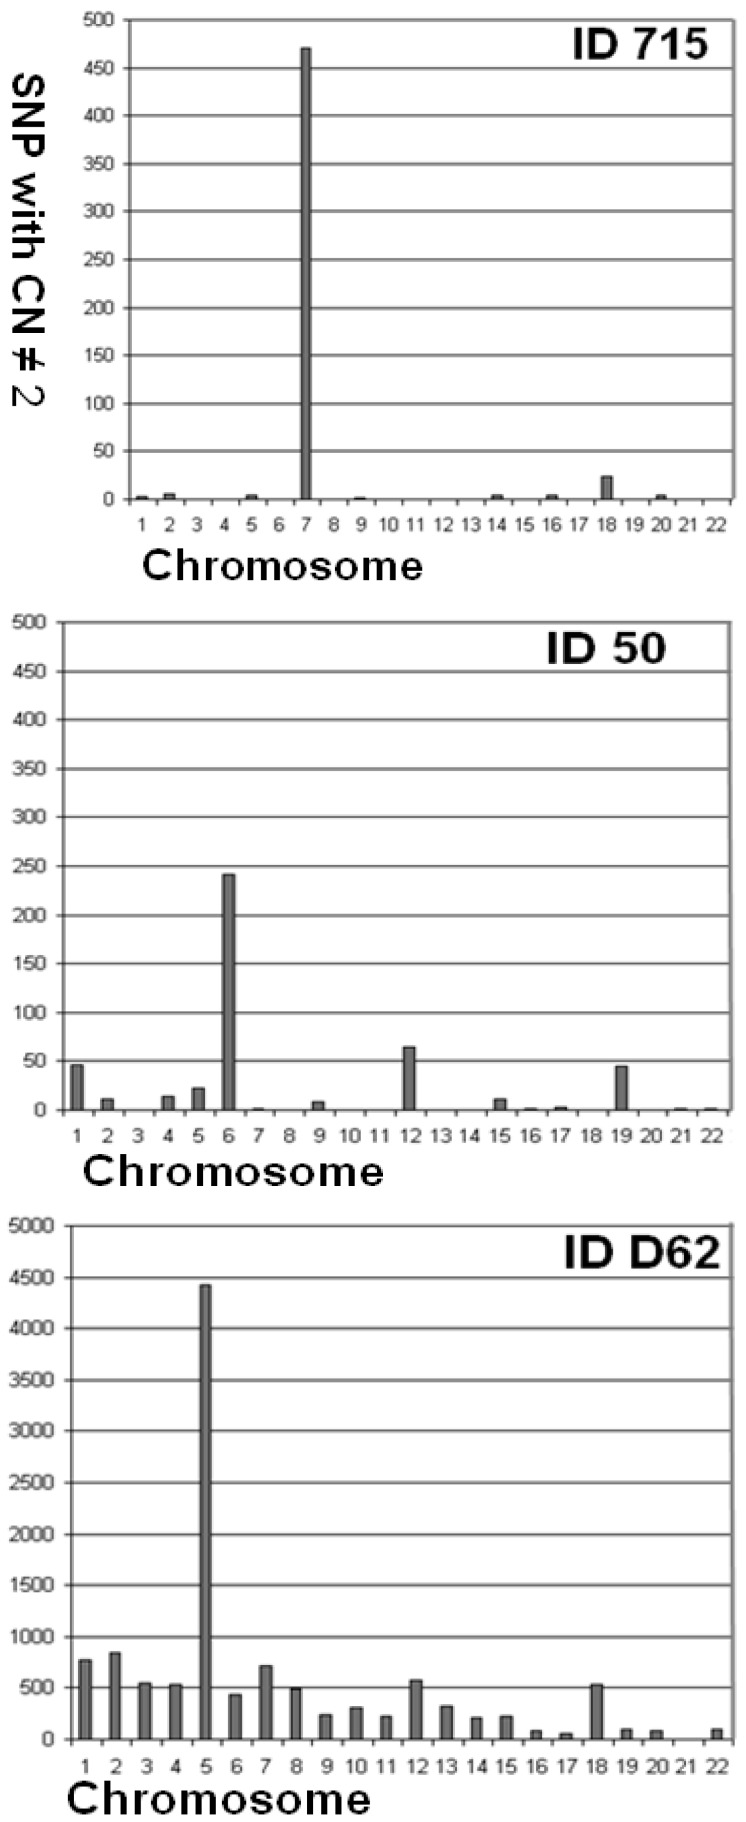
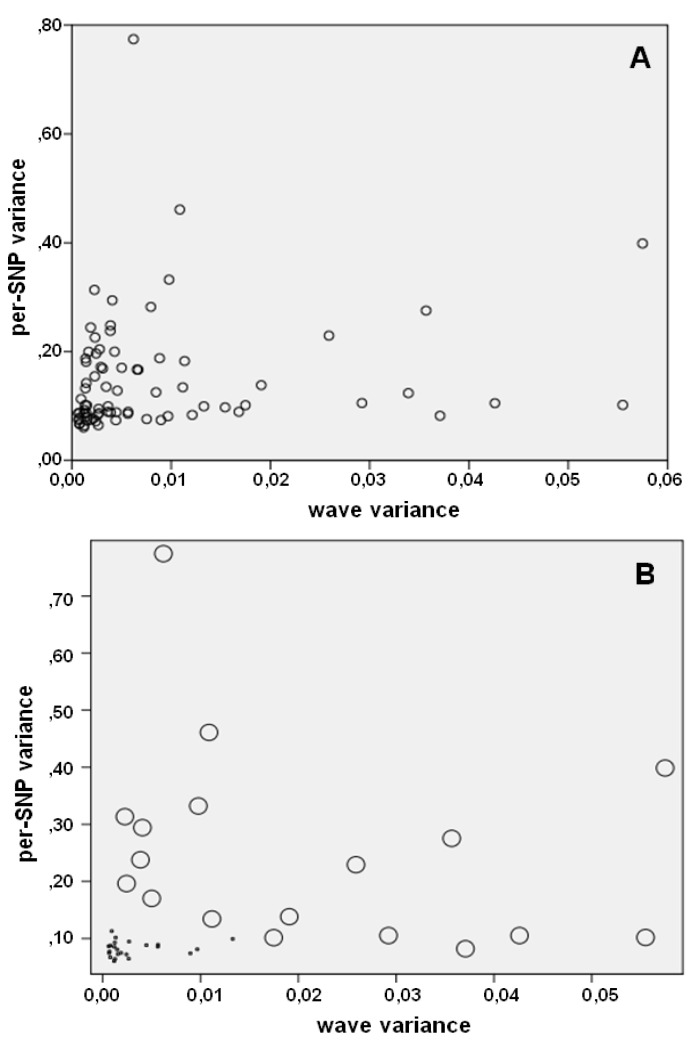
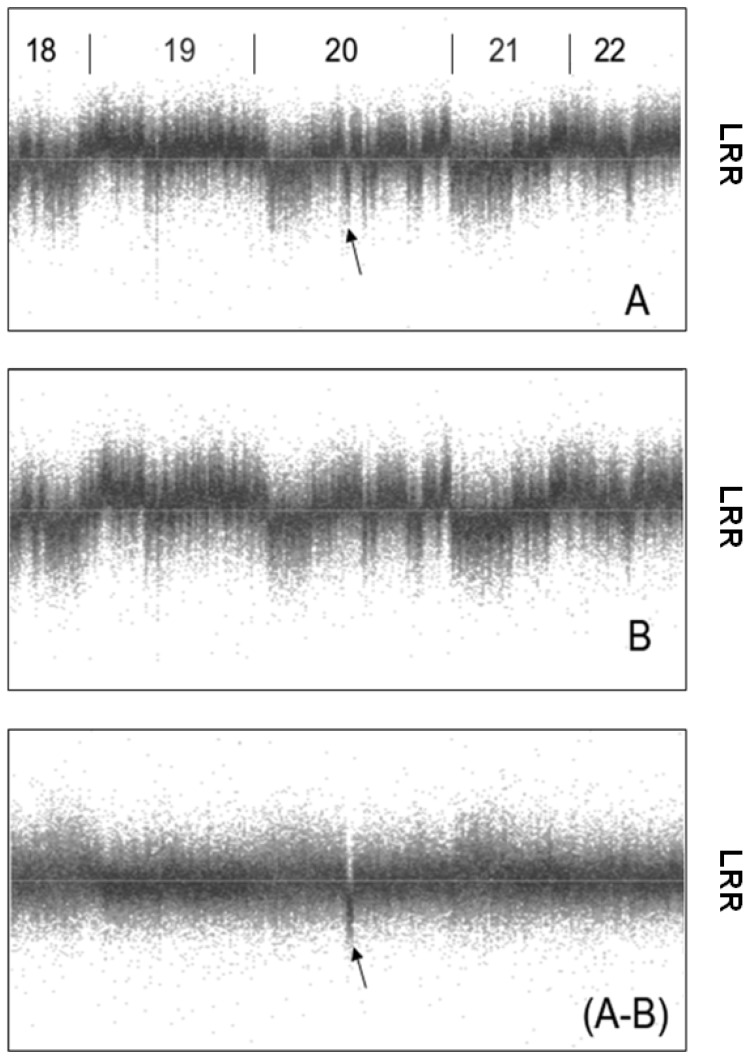
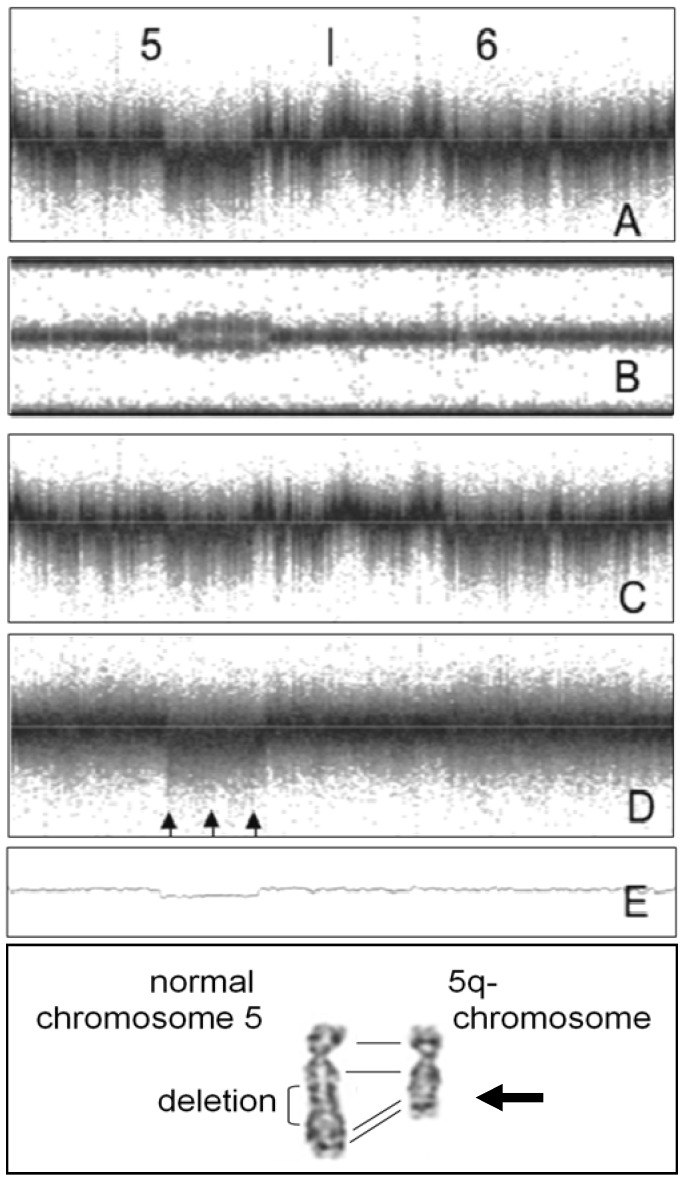
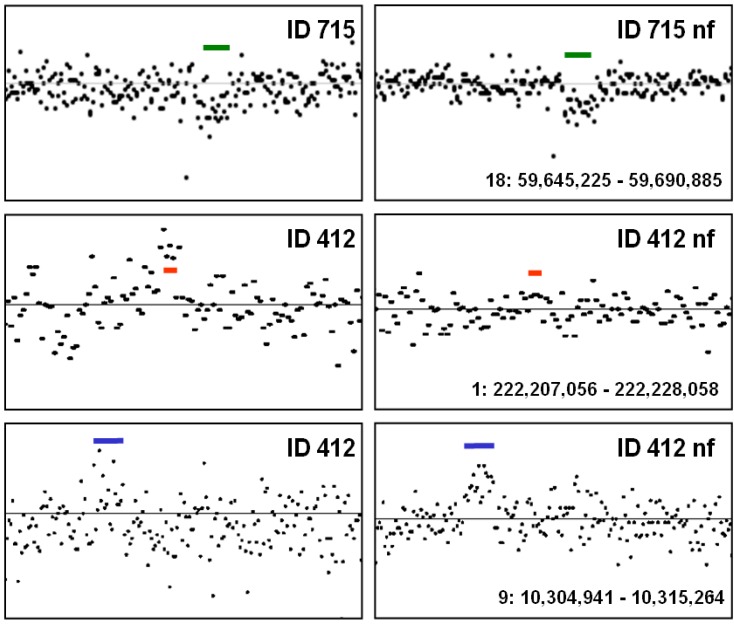
System noise was analyzed in 77 Affymetrix 6.0 samples from a previous clinical study of copy number variation (CNV). Twenty-three samples were classified as eligible for CNV detection, 29 samples as ineligible and 25 were classified as being of intermediate quality. New software ("noise-free-cnv") was developed to visualize the data and reduce system noise. Fresh DNA preparations were more likely to yield eligible samples (p < 0.001). Eligible samples had higher rates of successfully genotyped SNPs (p < 0.001) and lower variance of signal intensities (p < 0.001), yielded fewer CNV findings after Birdview analysis (p < 0.001), and showed a tendency to yield fewer PennCNV calls (p = 0.053). The noise-free-cnv software visualized trend patterns of noise in the signal intensities across the ordered SNPs, including a wave pattern of noise, being co-linear with the banding pattern of metaphase chromosomes, as well as system deviations of individual probe sets (per-SNP noise). Wave noise and per-SNP noise occurred independently and could be separately removed from the samples. We recommend a two-step procedure of CNV validation, including noise reduction and visual inspection of all CNV calls, prior to molecular validation of a selected number of putative CNVs.

Keywords: copy number variation (CNV); noise reduction; noise-free-cnv software; per-SNP noise; validation of CNV findings; variance; wave noise.


Figures

Figure 1
Figure 1
Signal strength (LRR) and B-allele frequency (BAF) of samples from two male patients (ID 2355 and ID 1022). SNPs were visualized in increasing position along the chromosomes. LRR values of patient ID 2355 have larger variance and show pronounced wave noise.
Figure 2
Figure 2
Wave noise. Ideograms of pro-metaphase (A) and metaphase (B) chromosome 7 were compared with signal intensities of SNPs of chromosome 7 of two patients (C,D) and with a human prometaphase (E) and metaphase (F) chromosome 7. Signal intensities shown in C and D were smoothed (noise-free-cnv software, function “blur” across 1,000 probe sets) to visualize genomic waves (G,H).
Figure 3
Figure 3
Noise components. LRR values of a noisy sample (A), split up in wave component (B) and per-SNP component (C). All SNPs of chromosomes 1–3 were shown (chromosomes indicated on top of panel A).
Figure 4
Figure 4
per-SNP system noise. Signal intensities in genomic region 2: 189766706–189891527 shown for four patients (ID 1020; ID 1022; ID1026; ID 1028). The lower panel shows the per-SNP median profile (median signal intensities) of all samples (n = 77). Arrows and arrowheads indicate SNPs with LRR values far above and below the mean.
Figure 5
Figure 5
Quality of copy number samples. Number of SNPs with CN ≠ 2 per chromosome were scored. Sample ID 715 is eligible for CNV studies (most chromosomes without SNPs with CN ≠ 2). Accumulation of aberrant SNPs in chromosome 7 and 18 indicates presence of rare CNVs. Sample ID 50 is of intermediate quality. Sample ID 062 was classified as ineligible for CNV studies (>100 SNPs with CN ≠ 2 in most chromosomes).
Figure 6
Figure 6
Wave variance and per-SNP variance. (A) Noise components in all 77 samples and (B) in samples of low (O) and high (●) quality (samples of intermediate quality were not included in (B)).
Figure 7
Figure 7
Signal intensities (y-axis: LRR values) of all SNPs from chromosome 18q up to chromosome 22. (A) Patient ID 1091; (B) reference sample ID 2355. After subtraction of the samples, a deletion in chromosome 20 became apparent (arrow).
Figure 8
Figure 8
Sample with mosaic large deletion in chromosome 5q. (A,B) LRR- and BAF-values of SNPs of chromosomes 5 and 6 of patient. (C) LRR values of reference sample. (D) Signal intensities after subtraction of reference sample. Arrows indicate region with reduced LRR values. (E) LRR values after application of noise-free-cnv blur over 2,000 SNPs. (Bottom panel) Chromosome analysis of cultured peripheral blood lymphocytes from patient (courtesy of Johannes W.G. Janssen, Department of Human Genetics, University of Heidelberg). Arrow points to 5q-minus chromosome.
Figure 9
Figure 9
Validation of CNV findings. Left panels show crude LRR values, left panels show LRR values after noise-free-cnv-filter analysis. Samples were renamed with suffix “nf” after noise-free-cnv-filter analysis. Bars indicate putative CNV findings.

References

    1. Girirajan S., Campbell C.D., Eichler E.E. Human copy number variation and complex genetic disease. Annu. Rev. Genet. 2011;45:203–226. doi: 10.1146/annurev-genet-102209-163544. - DOI - PMC - PubMed
    1. Zhang F., Gu W., Hurles M.E., Lupski J.R. Copy number variation in human health, disease, and evolution. Annu. Rev. Genomics Hum. Genet. 2009;10:451–481. doi: 10.1146/annurev.genom.9.081307.164217. - DOI - PMC - PubMed
    1. Fakhro K.A., Choi M., Ware S.M., Belmont J.W., Towbin J.A., Lifton R.P., Khokha M.K., Brueckner M. Rare copy number variations in congenital heart disease patients identify unique genes in left-right patterning. Proc. Natl. Acad. Sci. USA. 2011;108:2915–2920. doi: 10.1073/pnas.1019645108. - DOI - PMC - PubMed
    1. Priebe L., Degenhardt F., Strohmaier J., Breuer R., Herms S., Witt S.H., Hoffmann P., Kulbida R., Mattheisen M., Moebus S., et al. Copy number variants in german patients with schizophrenia. PLoS One. 2013;8:e64035. doi: 10.1371/journal.pone.0064035. - DOI - PMC - PubMed
    1. Vandeweyer G., Kooy R.F. Detection and interpretation of genomic structural variation in health and disease. Expert. Rev. Mol. Diagn. 2013;13:61–82. doi: 10.1586/erm.12.119. - DOI - PubMed

LinkOut - more resources