. 2016 Sep 8:6:32866.
doi: 10.1038/srep32866.

Site-specific fluorescent labeling to visualize membrane translocation of a myristoyl switch protein

Affiliations

Site-specific fluorescent labeling to visualize membrane translocation of a myristoyl switch protein

Sung-Tae Yang et al. Sci Rep. .

Abstract

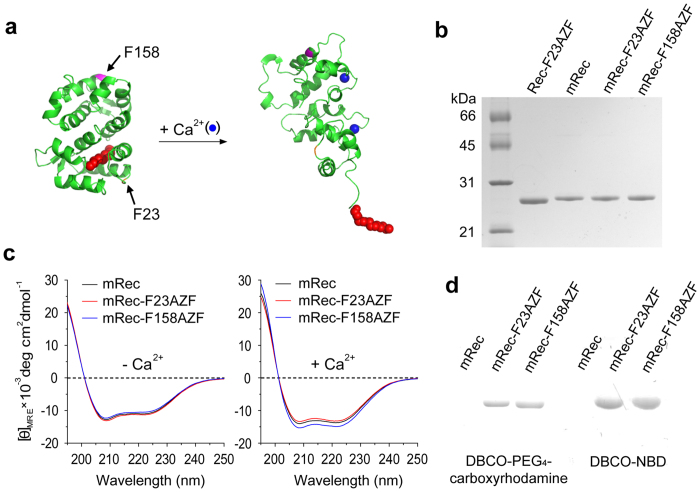
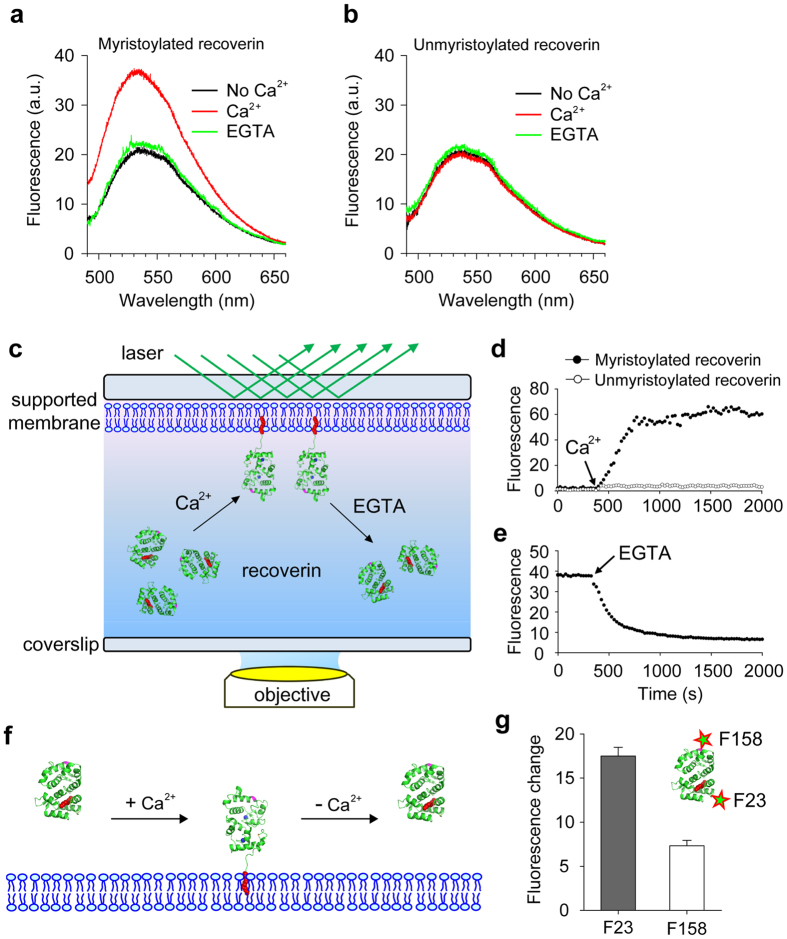
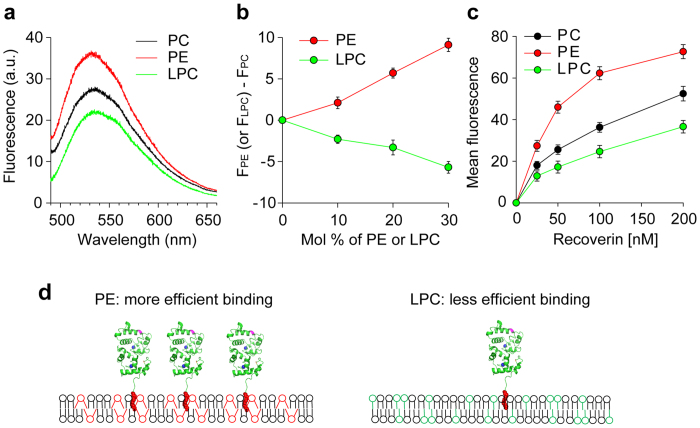
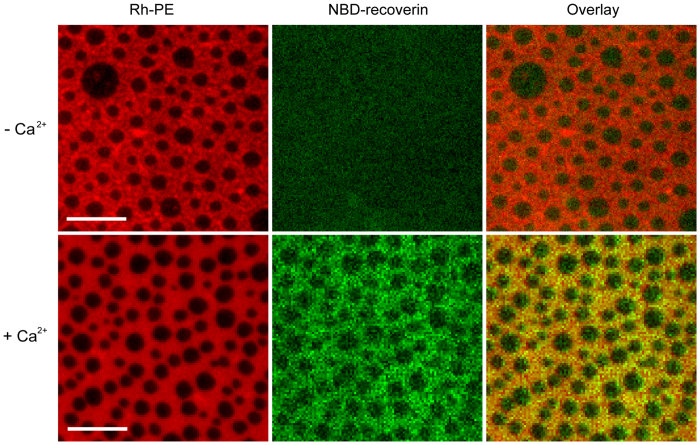
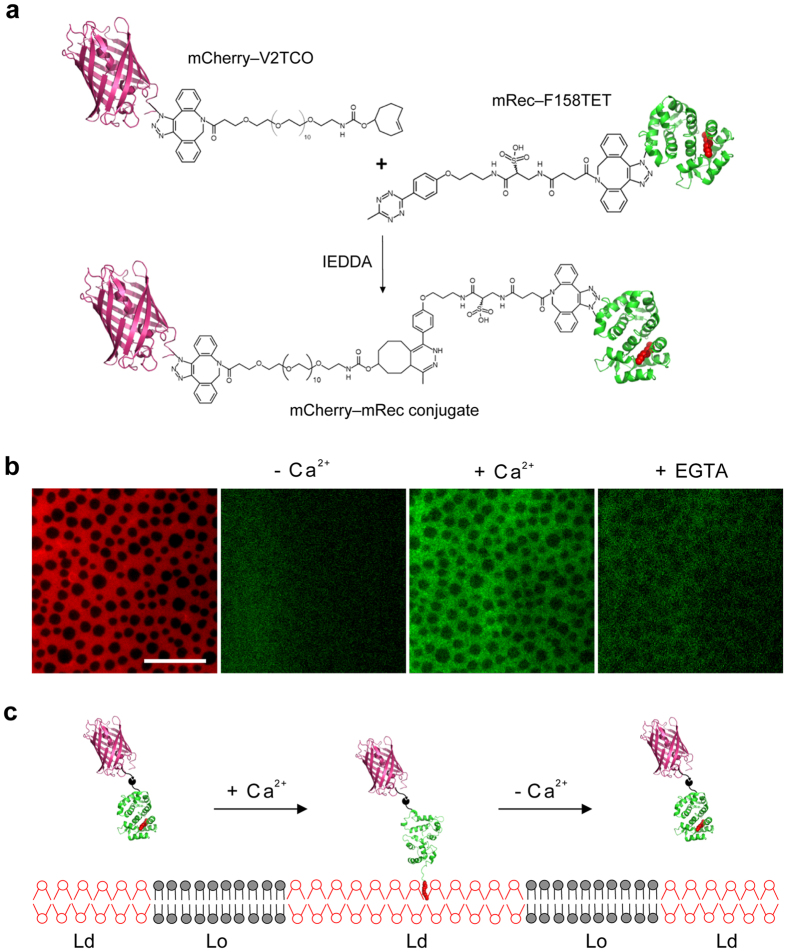
Fluorescence approaches have been widely used for elucidating the dynamics of protein-membrane interactions in cells and model systems. However, non-specific multi-site fluorescent labeling often results in a loss of native structure and function, and single cysteine labeling is not feasible when native cysteines are required to support a protein's folding or catalytic activity. Here, we develop a method using genetic incorporation of non-natural amino acids and bio-orthogonal chemistry to site-specifically label with a single fluorescent small molecule or protein the myristoyl-switch protein recoverin, which is involved in rhodopsin-mediated signaling in mammalian visual sensory neurons. We demonstrate reversible Ca(2+)-responsive translocation of labeled recoverin to membranes and show that recoverin favors membranes with negative curvature and high lipid fluidity in complex heterogeneous membranes, which confers spatio-temporal control over down-stream signaling events. The site-specific orthogonal labeling technique is promising for structural, dynamical, and functional studies of many lipid-anchored membrane protein switches.


Figures

Figure 1
Figure 1. Genetic incorporation of the non-natural amino acid AZF into two selected positions of recoverin.
(a) Three dimensional structures of recoverin in its Ca2+-free (PDB code: 1IKU; left) and Ca2+-bound (PDB code: 1JSA; right) forms. Sites selected for mutation are marked with arrows. The N-myristoyl chain is represented by red spheres. (b) SDS-PAGE of purified recoverin and variants: Lane 1, non-myristoylated Rec-F23AZF; Lane 2, myristoylated recoverin; Lane 3, mRec-F23AZF; Lane 4, mRec-F158AZF. (c) Far-UV CD spectra of recoverin and variants in the absence or presence of 1 mM Ca2+. (d) In-gel fluorescence of recoverin and variants reacted with DBCO-PEG4-carboxyrhodamine (left) or DBCO-NBD (right): Lane 1, mRec; Lane 2, mRec-F23AZF; Lane 3, mRec-F158AZF. The labeled protein bands run at 24 kDa as shown with the mCherry reference in Supplementary Fig. 4.
Figure 2
Figure 2. Ca2+-dependent binding of myristoylated recoverin to membranes.
NBD-labeled myristoylated (mRec-F23NBD) and unmyristoylated (Rec-F23NBD) versions of recoverin were used for spectrometric measurements of membrane association. Fluorescence emission spectra of 0.1 μM mRec-F23NBD (a) and Rec-F23NBD (b) were recorded in LUVs (0.1 mM total lipids) composed of PC/PE (7:3 mol:mol) in the absence (black) and presence (red) of 1 mM Ca2+. 2 mM EGTA was added after 1 h incubation of recoverin with 1 mM Ca2+ (green). (c) Schematic of TIRF microscopy approach used to monitor the association and dissociation of recoverin to supported membranes. (d) Binding of 0.1 μM mRec-F23NBD and Rec-F23NBD to supported membranes composed of PC:PE (7:3 mol:mol). Mean fluorescence intensity over time, indicating recoverin binding to the membrane after addition of 1 mM Ca2+. (e) Dissociation of mRec-F23NBD from supported membranes. Mean fluorescence intensity over time, indicating recoverin dissociation from the membrane after addition of 2 mM EGTA. (f) Schematic diagram of recoverin-membrane interaction. The myristoyl group of recoverin is exposed by the Ca2+ binding and inserts into the membranes. Such recoverin binding can be dissociated from the membrane by Ca2+ removal. (g) Position-dependent NBD fluorescence intensity of membrane-bound recoverin. Fluorescence changes of mRec-F23NBD and mRec-F158NBD by Ca2+ addition were measured. Data are representative of three experiments in a, b, d, and e, and mean ± s.d. of triplicates in g.
Figure 3
Figure 3. Effect of spontaneous membrane curvature on membrane association of recoverin.
(a) Fluorescence emission spectra of 0.1 μM mRec-F23NBD were recorded in the presence of LUVs (0.1 mM total lipids) composed of PC, PC:PE (7:3), or PC:LPC (7:3) and in the presence of 1 mM Ca2+. (b) Relative fluorescence intensities measured as a function of the mol fractions of PE (red) or LPC (green) in PC bilayers at excitation and emission wavelengths of 475 and 530 nm, respectively. (c) Mean fluorescence intensity recorded by TIRF microscopy for the binding of mRec-F158NBD to supported membranes composed of PC, PC:PE (7:3), or PC:LPC (7:3) in the presence of 1 mM Ca2+. (d) Schematic diagram of lipid-dependent association of recoverin to membranes. Recoverin binds more efficiently to membranes containing cone-shaped lipids (PE) than inverted cone-shaped lipids (LPC). Data are representative of three experiments in a, and mean ± s.d. of triplicates in b and c.
Figure 4
Figure 4. Visualization of Ca2+-dependent association of mRec-F23NBD to phase-separated supported membranes.
Supported membranes with coexisting Lo/Ld phases (left panels) were composed of DPPC:DOPC:Cholesterol (2:2:1). The membranes were labeled with 0.1 mol% Rh-PE, which preferentially partitions into the Ld phase. Myristoyl-Rec-F23NBD was added to the membranes in the absence (top row) and presence (bottom row) of 1 mM Ca2+ (middle panels). The overlay (right panels) shows that mRec-F23NBD (green) associates with the Ld phase (red) on supported membranes in the presence of Ca2+. Scale bars are 10 μm. Representative images of three experiments.
Figure 5
Figure 5. Synthesis of mCherry-recoverin conjugate and its Ca2+-responsive translocation to phase-separated supported membrane.
(a) Schematic diagram of coupling between mCherry-V2TCO and mRec-F158TET. (b) Ca2+-dependent binding of the mCherry-recoverin conjugate to a supported membrane with ordered and disordered lipid domains. Supported membranes (left) were composed of DPPC:DOPC:Cholesterol (2:2:1) with coexisting Lo (dark) and Ld (red) phases. The membranes were labeled with 0.5 mol% DiD, which preferentially partitions into the Ld phase. The mCherry-recoverin conjugate was added to the membranes in the absence (center left) or in the presence (center right) of Ca2+. Addition of 2 mM EGTA (right) extracts most of the membrane-bound conjugate. Scale bar is 20 μm. Representative images of three experiments. (c) Schematic diagram depicting the reversible translocation of mCherry via the Ca2+-sensitive myristoyl chain (red) of recoverin into fluid phase regions of a phase-separated Lo/Ld membrane.

References

    1. Weiss S. Fluorescence spectroscopy of single biomolecules. Science 283, 1676–1683 (1999). - PubMed
    1. Moerner W. E. & Fromm D. P. Methods of single-molecule fluorescence spectroscopy and microscopy. Rev Sci Instrum 74, 3597–3619 (2003).
    1. Joo C., Balci H., Ishitsuka Y., Buranachai C. & Ha T. Advances in single-molecule fluorescence methods for molecular biology. Annu Rev Biochem 77, 51–76 (2008). - PubMed
    1. Dizhoor A. M. et al. Recoverin: a calcium sensitive activator of retinal rod guanylate cyclase. Science 251, 915–918 (1991). - PubMed
    1. Gray-Keller M. P., Polans A. S., Palczewski K. & Detwiler P. B. The effect of recoverin-like calcium-binding proteins on the photoresponse of retinal rods. Neuron 10, 523–531 (1993). - PubMed

Publication types

MeSH terms