. 2016 Sep 8:6:32753.
doi: 10.1038/srep32753.

HIPSTR and thousands of lncRNAs are heterogeneously expressed in human embryos, primordial germ cells and stable cell lines

Affiliations

HIPSTR and thousands of lncRNAs are heterogeneously expressed in human embryos, primordial germ cells and stable cell lines

Dinar Yunusov et al. Sci Rep. .

Erratum in

Abstract

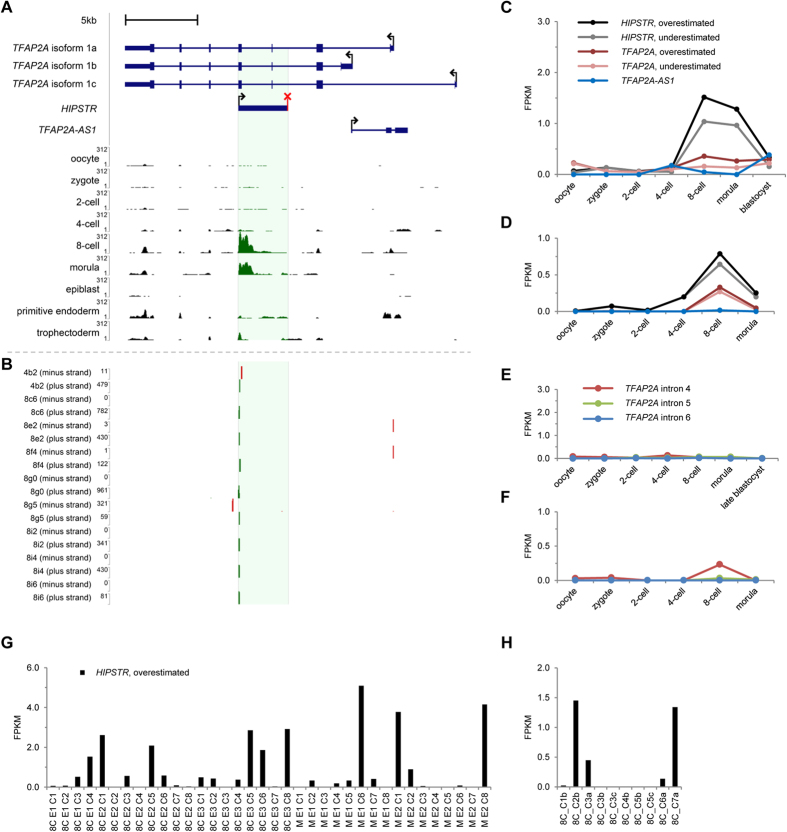
Eukaryotic genomes are transcribed into numerous regulatory long non-coding RNAs (lncRNAs). Compared to mRNAs, lncRNAs display higher developmental stage-, tissue-, and cell-subtype-specificity of expression, and are generally less abundant in a population of cells. Despite the progress in single-cell-focused research, the origins of low population-level expression of lncRNAs in homogeneous populations of cells are poorly understood. Here, we identify HIPSTR (Heterogeneously expressed from the Intronic Plus Strand of the TFAP2A-locus RNA), a novel lncRNA gene in the developmentally regulated TFAP2A locus. HIPSTR has evolutionarily conserved expression patterns, its promoter is most active in undifferentiated cells, and depletion of HIPSTR in HEK293 and in pluripotent H1BP cells predominantly affects the genes involved in early organismal development and cell differentiation. Most importantly, we find that HIPSTR is specifically induced and heterogeneously expressed in the 8-cell-stage human embryos during the major wave of embryonic genome activation. We systematically explore the phenomenon of cell-to-cell variation of gene expression and link it to low population-level expression of lncRNAs, showing that, similar to HIPSTR, the expression of thousands of lncRNAs is more highly heterogeneous than the expression of mRNAs in the individual, otherwise indistinguishable cells of totipotent human embryos, primordial germ cells, and stable cell lines.


Figures

Figure 1
Figure 1. HIPSTR is a bona fide lncRNA.
(A) Genomic position of human HIPSTR relative to the TFAP2A locus genes. The predicted HIPSTR polyadenylation signal is marked with a red “X” sign; genomic coordinates of the region shown are hg19 chr6:10396400–10420700. (B) RNA Pol II inhibition by α-amanitin in HeLa cells decreases HIPSTR levels; known RNA Pol II transcripts (ACTB, MYC) and RNA Pol III transcripts (pre-tRNATyr, 7SK) served as controls. (C) 5′-cap structure removal by co-treatment of HeLa cells total RNA with Terminator 5′-phosphate-dependent exonuclease (Ter) and tobacco acid pyrophosphatase (TAP) reduces levels of HIPSTR; capped TUBA1C and uncapped SNORD15A transcripts served as controls. (D) HeLa cells fractionation shows nuclear enrichment of HIPSTR; nuclear enrichment of TFAP2A and TFAP2A-AS1 is comparable with that of ACTB; TFAP2A pre-mRNA, MALAT1 lncRNA, and 45S rRNA served as nuclear fraction controls; 18S rRNA served as cytoplasmic fraction control. The same RNA samples were used as in ref. , and data shown on (BD) for control transcripts are the same as presented on Fig. 3A,B,D in ref. . (E) HIPSTR expression cannot be associated with tumor or non-tumor phenotype, as measured in human tumor (solid bars) and non-tumor (hatched bars) cell lines; expression in non-tumor HEK293 cell line (hatched green bar) is shown for comparison. (F) HIPSTR expression does not correlate with TFAP2A levels in the human cell lines shown on (E). (G) HIPSTR expression does not correlate with TFAP2A levels in the ENCODE Project RNA-seq data from human cell lines (A549, GM12878, H1 hESCs, HeLa-S3, HepG2, HMEC, HSMM, HUVEC, K562, MCF7, NHEK). (H) HIPSTR expression does not correlate with TFAP2A levels in the human tissues shown on (J) (see below). (I) Mouse Hipstr (mm9 chr13:40818458–40821725) ortholog expression across a panel of mouse tissue RNA samples from the Mouse ENCODE Project RNA-seq data. (J) HIPSTR expression across a panel of human tissue RNA samples. Data shown on (BF,H,J) are RT-qPCR read-outs of three independent experiments, error bars represent SD; data on (I,G) is our re-analysis of public RNA-seq; N/D – not detected.
Figure 2
Figure 2. TFAP2A can regulate HIPSTR promoter, but HIPSTR and TFAP2A are not consistently co-induced in in vitro developmental models.
(A) Re-analyses of H3K4me3 ChIP-seq data from refs , , , reveal conserved HIPSTR promoter demarcation across the genomes of 10 mammalian species (see Methods) and of chicken, and absence of H3K4me3 mark around HIPSTR TSS orthologous region in frog and zebrafish. The maximal value on the y-axis scale corresponds to the highest H3K4me3 peak across the entire TFAP2A locus for each species. (B) Positions of the mapped H3K4me3 and TFAP2A ChIP-seq reads from ref. (HeLa-S3 cells) and ref. (three human NCC and two chimp NCC lines), and positions of the DNA sequences used for HIPSTR promoter-reporter assays (pGL3-P1 to -P7) relative to the TFAP2A locus genes. (C) Luciferase reporter assays in HEK293 cells upon TFAP2A isoform 1a overexpression. DNA sequences surrounding HIPSTR TSS (see above) were cloned upstream of the firefly luciferase gene, and co-transfected with plasmid overexpressing TFAP2A isoform 1a or with empty vector; pGL3-Basic served as negative control (no promoter upstream of the firefly luciferase); pGL3-SV40 served as positive control (SV40 promoter upstream of the firefly luciferase); 3xAP2bluc served as positive control for transactivation by TFAP2A isoform 1a. (D) Overexpression of TFAP2A isoforms 1a (dark red), 1b (red), or 1c (pink) upregulates endogenous HIPSTR in HEK293 cells, as measured with RT-qPCR. (EG) HIPSTR is moderately co-upregulated with TFAP2A in in vitro derived human NCCs (E), weakly co-upregulated with TFAP2A in in vitro derived human TBCs (F), and not co-upregulated with TFAP2A in NT2/D1 cells treated with ATRA, where HIPSTR remains undetectable (G), as measured with RT-qPCR. Upregulation of TFAP2A gene itself (NCCs marker), of CGB (human TBCs marker), or HOXB5 gene (induced by ATRA treatment in NT2/D1 cells) served as positive controls in the corresponding experiments shown on (EG). Experiments presented on (CG) were performed in triplicate, and error bars represent SD. For experiments on (C,D) the asterisks indicate statistical significance of the observed changes calculated with two-tailed t-test, equal variance (p-value < 0.01).
Figure 3
Figure 3. Developmental genes are affected by HIPSTR knockdown in HEK293 and H1BP cells.
(A) Effect of HIPSTR knockdown on the expression of TFAP2A locus genes in HEK293 cells. (B) HIPSTR knockdown does not significantly affect (p-value < 0.05, fold-change >2) the abundance of TFAP2A isoforms or pre-mRNA. (C) Heat map showing that HIPSTR knockdown in HEK293 cells leads to a significant upregulation of 377 annotated genes outside of TFAP2A locus (1% FDR, fold-change >2, also see Table S1). (D) Efficiency of HIPSTR knockdown in H1BP cells. (E) Overlap between genes differentially expressed upon HIPSTR silencing in HEK293 and H1BP cells (also see Table S2). (F) Validation of a group of genes, whose expression is significantly up- and downregulated by HIPSTR knockdown in HEK293 (top panel) and H1BP cells (bottom panel), correspondingly. (G) Heat map demonstrating that HIPSTR knockdown in H1BP cells leads to significant upregulation of 572 and downregulation of 777 genes (1% FDR, fold-change >2, also see Table S3). Data shown on (A,B,D,F) are RT-qPCR read-outs of three independent experiments, error bars represent SD; N/D – not detected; the asterisks indicate statistical significance of the expression differences (fold-change >2) calculated with two-tailed t-test, equal variance (p-value < 0.05).
Figure 4
Figure 4. HIPSTR is expressed by a subset of cells in early human embryos.
(A) Mapping of RNA-seq reads from ref. illustrates specific expression of HIPSTR, and not TFAP2A or TFAP2A-AS1, in 8-cell and morula-stage human embryos. (B) Mapping of the 5′-ends of transcripts with strand-specific STRT-seq data from ref. shows specific expression of HIPSTR in one cell (4b2) from a 4-cell human embryo, and in eight cells (8c6 through 8i6) originating from five different 8-cell human embryos; cell names are as in ref. . (C,D) Re-analyses of aggregate RNA-seq data for each developmental stage from ref. on (C), and from ref. on (D) confirms that HIPSTR induction in early embryos is independent from TFAP2A and TFAP2A-AS1 genes. (E,F) TFAP2A pre-mRNA is not detectable in human oocytes and early embryos; re-analyses of aggregate RNA-seq data from ref. on (E), and from ref. on (F). (G,H) HIPSTR expression is restricted to a subset of cells in early human embryos, as inferred from RNA-seq data for 8-cell- and morula-stage embryos from ref. in (G), or RNA-seq data for 8-cell-stage embryos from ref. in (H); plotted are overestimated FPKM values for HIPSTR expression (see text).
Figure 5
Figure 5. LncRNAs show higher heterogeneity of expression than mRNAs.
(A–E) LncRNAs have higher cell-to-cell variation in expression than mRNAs. Coefficient of variation (CV) across all cells of a given single-cell RNA-seq data set was calculated for each expressed gene (>3 FPKM), and shown are box plots of CV values for highly expressed (>30 FPKM) mRNAs (dark orange) and lncRNAs (dark grey), and for moderately expressed (3–30 FPKM) mRNAs (light orange) and lncRNAs (light grey). Box shows the first and third interquartile range (IQR), the line inside the box shows the median, and whiskers encompass the CV values within 1.5 IQR below and above the first and third quartiles, respectively. Points outside the whiskers are CV outliers. All possible pairwise comparisons result in statistically significant differences, Welch’s t-test (p-value < 0.001). (FJ) Higher fraction of lncRNAs is classified as highly heterogeneously expressed, as compared to mRNAs. Plotted are density distributions of numbers of expressing cells calculated for lncRNAs (black dashed line), mRNAs (red dashed line), lncRNAs and mRNAs together (grey bars), and for modeled populations of genes with high (solid light blue line) or low (solid dark blue line) heterogeneity of expression. Pie charts demonstrate fractions of lncRNAs and mRNAs associated with the population of genes with high (light blue), low (dark blue) or uncertain (grey) heterogeneity of expression. Genes used for this analysis had expression >3 FPKM in at least one cell, and <30 FPKM in all cells of the corresponding data sets. Genes that contributed to the plots and pie charts on (FJ) were classified as belonging to either of the modeled populations of genes (with high or low expression heterogeneity) with a posterior probability >0.99, or were assigned the “uncertain heterogeneity” classification otherwise (posterior probability ≤0.99) (Tables S4,S5,S6,S7,S8). Single-cell RNA-seq data sets re-analyzed here were from: ref. (8-cell and morula stage embryos, hESCs), ref. (K562 cells), and ref. (7W hPGCs and 19 W hPGCs). Number of individual cells used for each analysis is in parentheses in each panel heading.

References

    1. Clark M. B. et al.. The reality of pervasive transcription. PLoS Biol 9, e1000625; discussion e1001102 (2011). - PMC - PubMed
    1. Djebali S. et al.. Landscape of transcription in human cells. Nature 489, 101–108 (2012). - PMC - PubMed
    1. Berretta J. & Morillon A. Pervasive transcription constitutes a new level of eukaryotic genome regulation. EMBO Rep 10, 973–982 (2009). - PMC - PubMed
    1. Iyer M. K. et al.. The landscape of long noncoding RNAs in the human transcriptome. Nat Genet 47, 199–208 (2015). - PMC - PubMed
    1. Quinn J. J. & Chang H. Y. Unique features of long non-coding RNA biogenesis and function. Nat Rev Genet 17, 47–62 (2015). - PubMed

Publication types