. 2016 Sep;6(9):160190.
doi: 10.1098/rsob.160190.

p38 (Mapk14/11) occupies a regulatory node governing entry into primitive endoderm differentiation during preimplantation mouse embryo development

Affiliations

p38 (Mapk14/11) occupies a regulatory node governing entry into primitive endoderm differentiation during preimplantation mouse embryo development

Vasanth Thamodaran et al. Open Biol. 2016 Sep.

Abstract

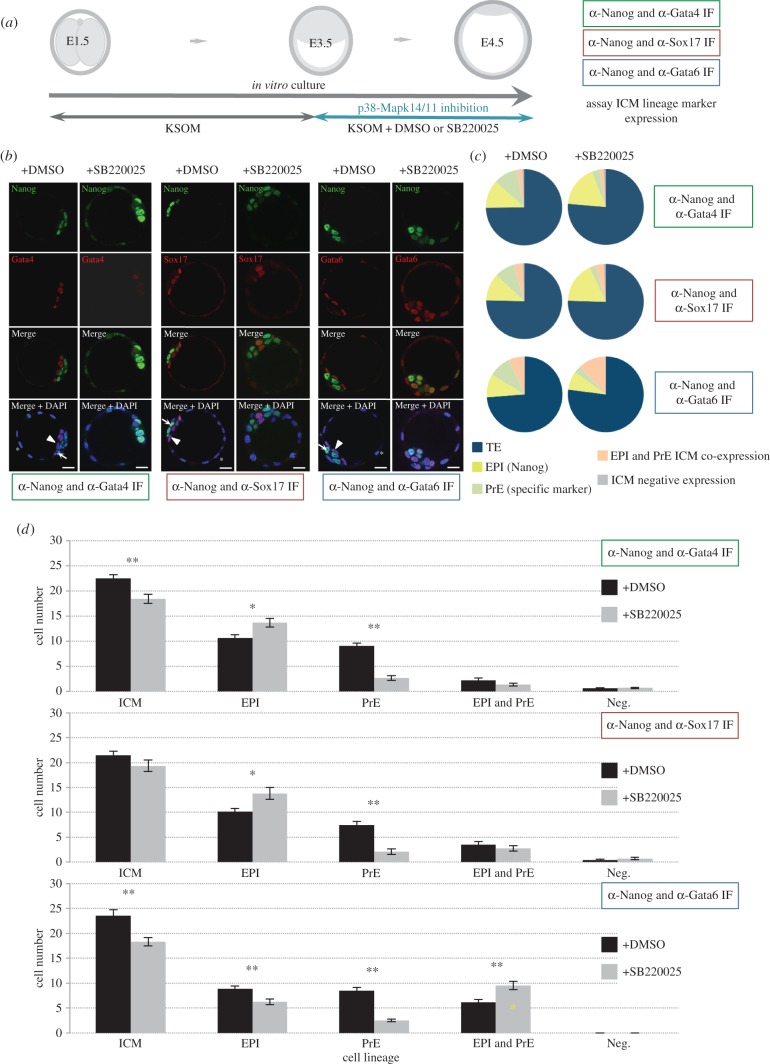
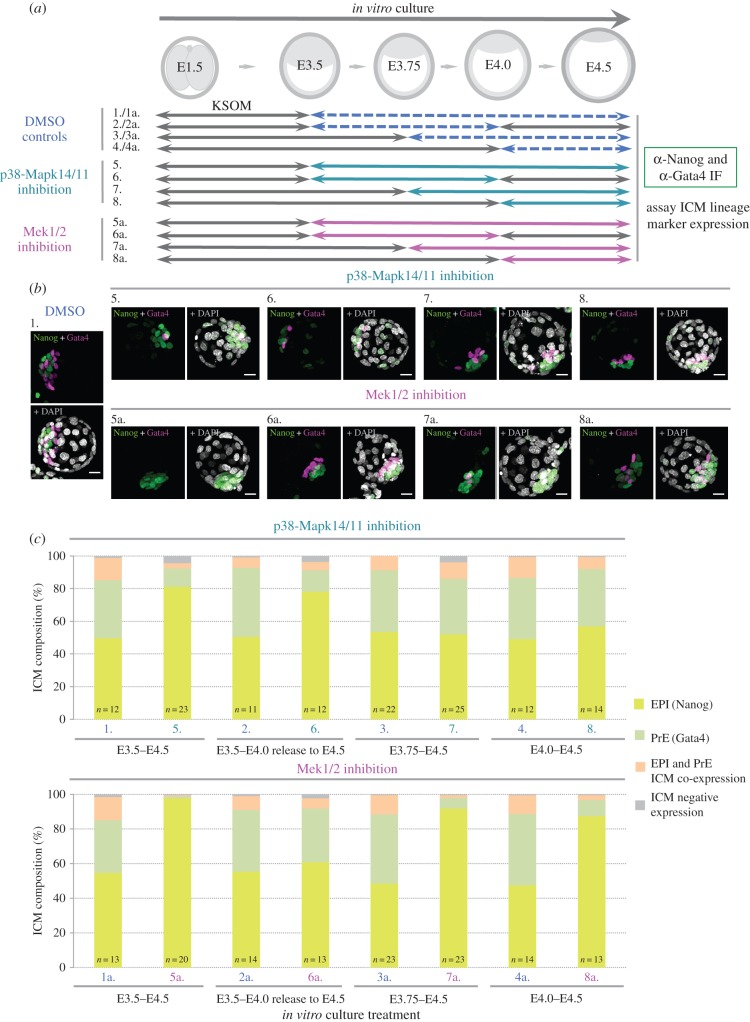
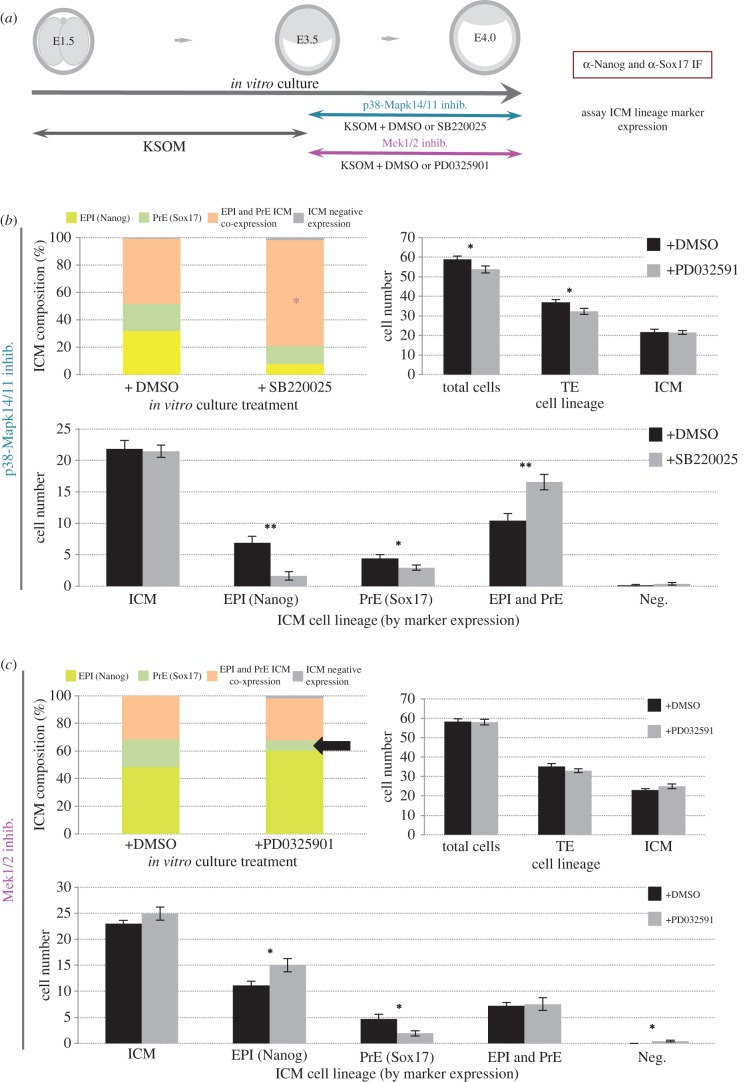
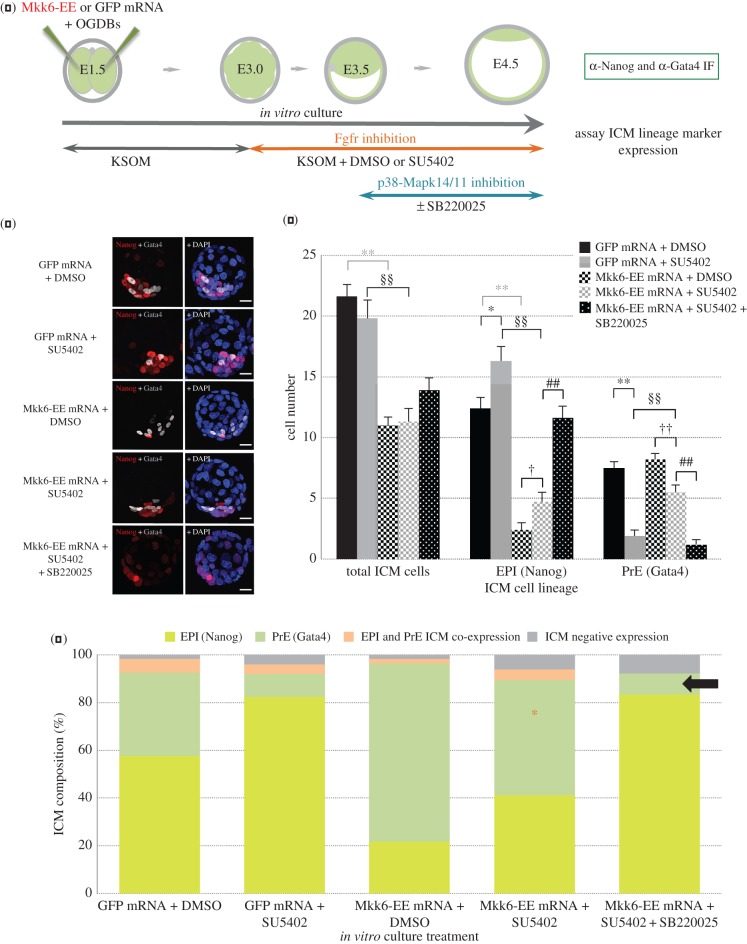
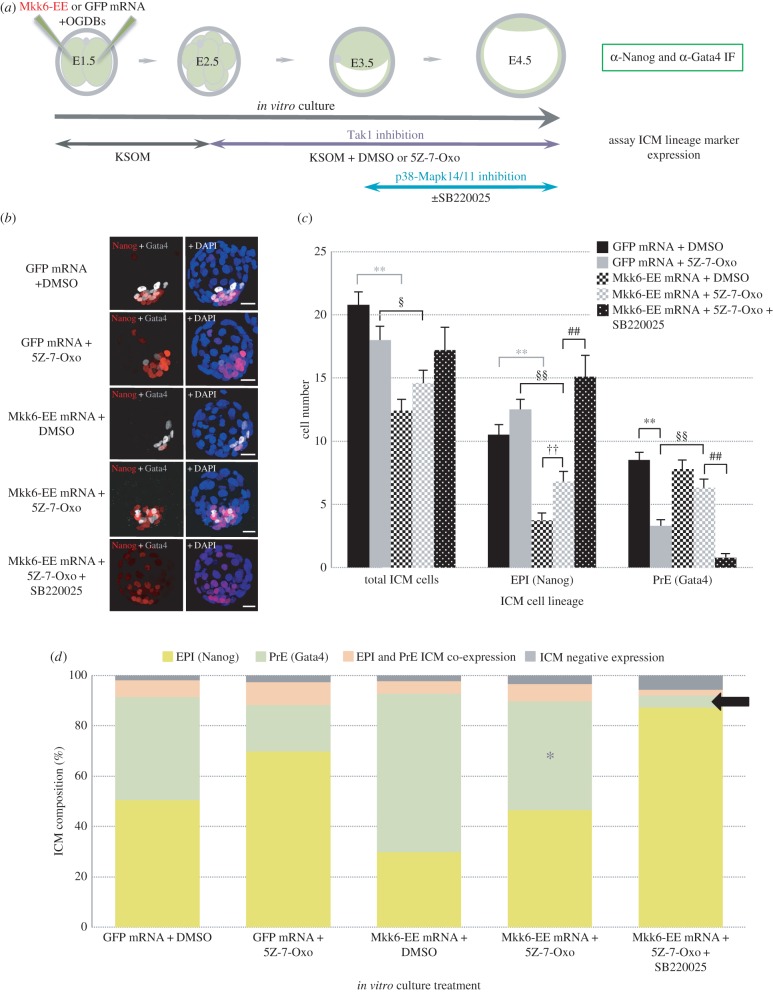
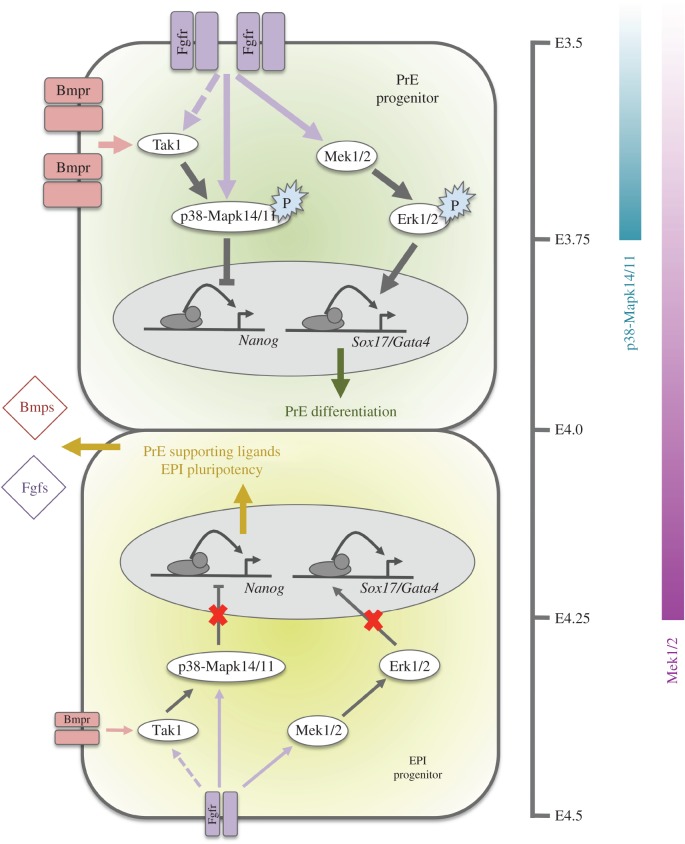
During mouse preimplantation embryo development, the classically described second cell-fate decision involves the specification and segregation, in blastocyst inner cell mass (ICM), of primitive endoderm (PrE) from pluripotent epiblast (EPI). The active role of fibroblast growth factor (Fgf) signalling during PrE differentiation, particularly in the context of Erk1/2 pathway activation, is well described. However, we report that p38 family mitogen-activated protein kinases (namely p38α/Mapk14 and p38β/Mapk11; referred to as p38-Mapk14/11) also participate in PrE formation. Specifically, functional p38-Mapk14/11 are required, during early-blastocyst maturation, to assist uncommitted ICM cells, expressing both EPI and earlier PrE markers, to fully commit to PrE differentiation. Moreover, functional activation of p38-Mapk14/11 is, as reported for Erk1/2, under the control of Fgf-receptor signalling, plus active Tak1 kinase (involved in non-canonical bone morphogenetic protein (Bmp)-receptor-mediated PrE differentiation). However, we demonstrate that the critical window of p38-Mapk14/11 activation precedes the E3.75 timepoint (defined by the initiation of the classical 'salt and pepper' expression pattern of mutually exclusive EPI and PrE markers), whereas appropriate lineage maturation is still achievable when Erk1/2 activity (via Mek1/2 inhibition) is limited to a period after E3.75. We propose that active p38-Mapk14/11 act as enablers, and Erk1/2 as drivers, of PrE differentiation during ICM lineage specification and segregation.

Keywords: cell signalling; cell-fate; mitogen-activated protein kinase; p38α/p38β Mapk14/Mapk11; preimplantation mouse embryo; primitive endoderm.


Figures

Figure 1.
Figure 1.
p38-Mapk14/11 inhibition during blastocyst maturation blocks PrE differentiation/maturation. (a) Experimental schema of p38-Mapk14/11 inhibition (+SB220025), plus vehicle control (+DMSO), and the details of antibodies used to analyse ICM cell lineage marker protein expression by immunofluorescence (IF) in late blastocysts (E4.5); Nanog and Gata4 (+DMSO n = 27, +SB220025 n = 33)—green, Nanog and Sox17 (+DMSO n = 18, +SB220025 n = 20)—red, and Nanog and Gata6 (+DMSO n = 24, +SB220025 n = 27)—blue. (b) Representative single confocal z-plane micrographs of vehicle control-treated (+DMSO) or p38-Mapk14/11 inhibited (+SB220025) late-blastocyst stage/equivalent embryos, immunofluorescently stained for indicated ICM cell lineage markers (Nanog in green and Gata4, Sox17 and Gata6 in red, plus DAPI DNA stain in blue). Examples of cells classified as TE, PrE and EPI are marked with an asterisk, arrowhead and arrow, respectively. Scale bar, 15 µm. (c) Pie charts of the relative cell lineage contribution in vehicle control (+DMSO) and p38-Mapk14/11 inhibited (+SB220025) blastocysts as judged by IF to detect the stated ICM lineage marker proteins. Blue, trophectoderm (TE); yellow, epiblast (EPI—ICM exhibiting exclusive Nanog expression); green, primitive endoderm (PrE—ICM exhibiting exclusive Gata4/6 or Sox17 expression, as appropriate); orange, uncommitted ICM cells (exhibiting co-expression of both Nanog and Gata4/6 or Sox17, as appropriate); and grey, ICM cells negative for either assayed marker. (d) Bar charts show average number of cells allocated to each specified ICM lineage, as judged by the indicated IF staining regime employed. Error bars represent s.e.m. and asterisks denote statistical significant differences in cell number between the vehicle control (+DMSO, black bars) and p38-Mapk14/11 inhibited (+SB220025, grey bars) embryo groups, according to two-tailed Student's t-test, with *p < 0.05 and **p < 0.005 confidence intervals. Yellow asterisk denotes increase in cells positively immunofluorescently staining for both EPI and PrE ICM markers using anti-Nanog and anti-Gata6 (an early PrE marker) antibodies. All individual embryo data used in the preparation of this figure are contained within the electronic supplementary material, table S3.
Figure 2.
Figure 2.
p38-Mapk14/11 is required for appropriate PrE derivation during early-blastocyst maturation and precedes Mek1/2 mediated PrE differentiation. (a) Experimental schema employed to identify the developmental timepoint at which p38-Mapk14/11 is required for PrE differentiation, compared with Mek1/2 activity. Two-cell (E1.5) stage embryos were in vitro cultured to varied blastocyst stages (ranging from E3.5 to E4.0, as indicated) and transferred into media supplemented with either p38-Mapk14/11 inhibitor (SB220025) or Mek1/2 inhibitor (PD0325901) or DMSO vehicle controls (note that the required concentrations of DMSO to control the p38-Mapk14/11 and Mek1/2 inhibition were not the same; hence the nomenclature of DMSO controls relating to Mek1/2 inhibition is suffixed here, and throughout the figure, with ‘a’). Embryos were then cultured to the late-blastocyst (E4.5) stage and fixed for IF staining against the ICM cell lineage markers Nanog and Gata4. Note that a second embryo group transferred at the early-blastocyst (E3.5) stage was removed from vehicle control/inhibitor treatment at the mid-blastocyst (E4.0) stage and returned to normal growth media before being similarly processed at the late-blastocyst (E4.5) stage. (b) Representative examples of immunofluorescently stained embryos as projected confocal z-stacks, from each of the above described treatment regimes (a); note the consistent use of nomenclature (for ease of presentation only one example of a DMSO-treated embryo is provided). Pseudo-coloured merges of detected Nanog (green) and Gata4 (magenta) protein are provided together with a further merge containing DAPI-derived DNA counterstain (pseudo-coloured white). Scale bar, 20 µm. (c) Percentage bar charts detailing the averaged relative cell lineage composition of ICMs from embryos derived from each of the above described treatment regimes (a); note the consistent use of nomenclature (and the change in the order of the treatments—for ease of interpretation DMSO vehicle control embryos are labelled in blue, p38-Mapk14/11 inhibited embryos in sea green and Mek1/2 inhibited embryos in magenta). The averaged percentage contribution of ICM cells to each lineage, within the chart, is highlighted: EPI (yellow), PrE (green), EPI and PrE ICM co-expression (orange) and ICM negative expression (grey). The number of embryos analysed in each group is highlighted within each percentage bar. Additionally, the same data are presented as the average number of cells contributing to each blastocyst lineage in the electronic supplementary material, figures S8 and S9. All individual embryo data used in the preparation of this figure are contained within the electronic supplementary material, tables S7 and S8.
Figure 3.
Figure 3.
p38-Mapk14/11 inhibition during early-blastocyst maturation produces ICM cells of uncommitted fate, whereas Mek1/2 inhibition prevents differentiation to the PrE lineage. (a) Experimental schema employed to study the effect on ICM lineage separation of p38-Mapk14/11 and Mek1/2 inhibition during early-blastocyst maturation. Cultured embryos were transferred to growth media supplemented with vehicle control (+DMSO; note two concentrations used depending on the specific inhibitor to be used—see below) or inhibitor against p38-Mapk14/11 (+SB220025) or Mek1/2 (PD0325901) and permitted to develop to the mid-blastocyst (E4.0) stage, fixed and immunofluorescently stained for EPI (Nanog) and PrE (Sox17) marker proteins. (b) Relating to p38-Mapk14/11 inhibition (n = 13 and 13 for control and inhibitor treated groups, respectively), and (c) relating to Mek1/2 inhibition experiments (n = 12 and 13 for control and inhibitor treated groups, respectively); percentage bar charts show the relative contribution of ICM cells to respective lineages (EPI in yellow, PrE in green, uncommitted cells expressing both EPI and PrE markers in orange and cells not expressing either marker in grey). Note, decreased maturation of EPI and PrE in p38-Mapk14/11 inhibited embryos is due to increased proportion of uncommitted cells (highlighted by magenta asterisk), whereas in Mek1/2 inhibited embryos the proportion of uncommitted cells is no different to controls but the contribution of solely Sox17 expressing PrE cells is diminished (highlighted by black arrow) and solely Nanog expressing EPI cells is increased; the average number of cells in each treatment and accompanying control regime, contributing to total embryo cell number, outer TE and inner ICM lineages are shown as bar charts, as is the average number of cells in each ICM lineage. Errors are representative of s.e.m. and asterisks denote statistical significant differences in cell number between the vehicle control (black bars) and p38-Mapk14/11 or Mek1/2 inhibited (grey bars) embryo groups, according to two-tailed Student's t-test, with *p < 0.05 and **p < 0.005 confidence intervals. All individual embryo data used in the preparation of this figure are contained within the electronic supplementary material, tables S9 and S10.
Figure 4.
Figure 4.
Inhibition of Fgf-receptors (Fgfr) inhibits PrE formation in a p38-Mapk14/11 dependent manner. (a) Experimental schema detailing the regime of Fgfr inhibition (+SU5402), with attendant vehicle control (+DMSO) condition, from the 16-cell to late-blastocyst (E3.0-E4.5) stages and optional p38-Mapk14/11 co-inhibition (±SB220025, from E3.5 to E4.5), employed. Also highlighted are mRNAs microinjected (together with Oregon-green conjugated dextran beads (OGDBs), to confirm successful mRNA delivery) into both blastomeres at the two-cell (E1.5) stage: the constitutively active, p38-Mapk14/11 targeting kinase, ‘Mkk6-EE’ mutant or microinjection control ‘GFP’. Immunofluorescence (IF) antibody details used to analyse ICM cell lineage marker protein expression in late blastocysts (E4.5) are also given. (b) Representative confocal z-plane projections of ICM lineage marker expression (Nanog, for EPI, in red and Gata4, for PrE, in grey-scale, plus DAPI DNA counter-stain in blue) in each of the studied conditions in late-blastocyst (E4.5) stage embryos: GFP microinjection control plus DMSO vehicle control (GFP mRNA + DMSO; n = 23), GFP microinjection control plus Fgfr inhibition (GFP mRNA + SU5402; n = 23), Mkk6-EE microinjection plus DMSO vehicle control (Mkk6-EE mRNA + DMSO; n = 24), Mkk6-EE microinjection plus Fgfr inhibition (Mkk6-EE mRNA + SU5402; n = 23) and Mkk6-EE microinjection plus Fgfr and p38-Mapk14/11 inhibition (Mkk6-EE mRNA + SU5402 + SB220025; n = 22). Scale bar, 15 µm. (c) Averaged contribution of cells to each ICM cell lineage, based on exclusive expression of either EPI (Nanog) or PrE (Gata4) lineage marker, in each of the stated experimental conditions. Errors are represented as s.e.m. and appropriate statistically significant differences, derived from two-tailed Student's t-tests, highlighted by one or two significance markers (one representing p < 0.05 and two denoting p < 0.005) described thus; asterisks (*) show differences between the ‘GFP mRNA + DMSO’ and ‘GFP mRNA + SU5402’ or ‘Mkk6-EE mRNA + DMSO’ (in grey) groups, the section symbol (§) highlights the significant difference between the ‘GFP mRNA + SU5402'and ‘Mkk6-EE + SU5402’ groups, crosses (†) between the ‘Mkk6-EE + DMSO’ and ‘Mkk6-EE + SU5402’ groups, and hashtags (#) denote divergence between the ‘Mkk6-EE + SU5402’ and ‘Mkk6-EE + SU5402 + SB220025’ groups. Data are also presented in the electronic supplementary material, table S11 (note, extra data relating to total cell and TE cell numbers are similarly described in the electronic supplementary material, figure S12). (d) Averaged percentage make-up of the ICMs of each stated condition in relation to each specified ICM lineage: EPI or PrE (yellow and green, exclusively immunostained for either Nanog or Gata4, respectively), EPI and PrE co-expressing cells (orange, representing cells uncommitted to either lineage) and cells negative for either studied lineage marker (grey). Orange asterisk denotes the rescue of the PrE component of ICM cells in Fgfr inhibited embryos expressing the p38-Mapk14/11 activating kinase mutant, Mkk6-EE (‘Mkk6-EE mRNA + SU5402’ group) compared with the appropriate Fgfr inhibited condition (the ‘GFP mRNA + SU5402’ group). Similarly, the black arrow highlights the ablation of this rescue effect by additional p38-Mapk14/11 inhibition (in the ‘Mkk6-EE mRNA + SU5402 + SB220025’ group).
Figure 5.
Figure 5.
Inhibition of Tak1 inhibits PrE formation in a p38-Mapk14/11 dependent manner. (a) Experimental schema detailing the regime of Tak1 inhibition (+5Z-7-Oxo), with attendant vehicle control (+DMSO) condition, from the eight-cell to late-blastocyst (E2.5–E4.5) stages and optional p38-Mapk14/11 co-inhibition (±SB220025, from E3.5 to E4.5), employed. Also highlighted are mRNAs microinjected (together with Oregon-green conjugated dextran beads (OGDBs), to confirm successful mRNA delivery) into both blastomeres at the two-cell (E1.5) stage: the constitutively active, p38-Mapk14/11 targeting kinase, ‘Mkk6-EE’ mutant or microinjection control ‘GFP’. Immunofluorescence (IF) antibody details used to analyse ICM cell lineage marker protein expression in late blastocysts (E4.5) are also given. (b) Representative confocal z-plane projections of ICM lineage marker expression (Nanog, for EPI, in red and Gata4, for PrE, in grey scale, plus DAPI DNA counterstain in blue) in each of the studied conditions in late-blastocyst (E4.5) stage embryos: GFP microinjection control plus DMSO vehicle control (GFP mRNA + DMSO; n = 22), GFP microinjection control plus Tak1 inhibition (GFP mRNA + 5Z-7-Oxo; n = 23), Mkk6-EE microinjection plus DMSO vehicle control (Mkk6-EE mRNA + DMSO; n = 25), Mkk6-EE microinjection plus Tak1 inhibition (Mkk6-EE mRNA + 5Z-7-Oxo; n = 25) and Mkk6-EE microinjection plus Tak1 and p38-Mapk14/11 inhibition (Mkk6-EE mRNA + 5Z-7-Oxo + SB220025; n = 21). Scale bar, 15 µm. (c) Averaged contribution of cells to each ICM cell lineage, based on exclusive expression of either EPI (Nanog) or PrE (Gata4) lineage marker, in each of the stated experimental conditions. Errors are represented as s.e.m. and appropriate statistically significant differences, derived from two-tailed Student's t-tests, highlighted by one or two significance markers (one representing p < 0.05 and two denoting p < 0.005) described thus; asterisks (*) show differences between the ‘GFP mRNA + DMSO’ and ‘GFP mRNA + 5Z-7-Oxo'or ‘Mkk6-EE mRNA + DMSO’ (in grey) groups, the section symbol (§) highlights the significant difference between the ‘GFP mRNA + 5Z-7-Oxo'and ‘Mkk6-EE + 5Z-7-Oxo’ groups, crosses (†) between the ‘Mkk6-EE + DMSO’ and ‘Mkk6-EE + 5Z-7-Oxo’ groups, and hashtags (#) denoting divergence between the ‘Mkk6-EE + 5Z-7-Oxo’ and ‘Mkk6-EE + 5Z-7-Oxo + SB220025’ groups. Data are also presented in the electronic supplementary material, table S12 (note, extra data relating to total cell and TE cell numbers are similarly described in the electronic supplementary material, figure S13). (d) Averaged percentage make-up of the ICMs of each stated condition in relation to each specified ICM lineage: EPI or PrE (yellow and green, exclusively immunostained for either Nanog or Gata4, respectively), EPI and PrE co-expressing cells (orange, representing embryos uncommitted to either lineage) and cells negative for either studied lineage marker (grey). Purple asterisk denotes the rescue of the PrE component of ICM cells in Tak1 inhibited embryos expressing the p38-Mapk14/11 activating kinase mutant, Mkk6-EE (‘Mkk6-EE mRNA + 5Z-7-Oxo’ group) compared with the appropriate Tak1 inhibited condition (the ‘GFP mRNA + 5Z-7-Oxo’ group). Similarly, the black arrow highlights the ablation of this rescue effect by additional p38-Mapk14/11 inhibition (in the ‘Mkk6-EE mRNA + 5Z-7-Oxo + SB220025’ group).
Figure 6.
Figure 6.
Revised model of PrE and EPI cell-fate specification and segregation during mouse blastocyst ICM maturation. In PrE progenitors, activated/liganded Bmp- and Fgf-receptors cause the activation of p38-Mapk14/11, via a mechanism at least partly dependent on Tak1 (note, theorized activation of Tak1 functionally downstream of Fgf-receptors is denoted by dashed line). Activation of p38-Mapk14/11, before E3.75, inhibits the expression of the pluripotency marker Nanog. Simultaneously, and for a period after E3.75 (until E4.25), activation of Mek1/2 and downstream Erk kinases (Erk1/2), also functionally downstream of Fgf-receptor signalling, promotes the expression of PrE markers (e.g. Sox17 and Gata4) required to drive PrE cell-fate. Hence, the combined effect of activating both p38-Mapk14/11 and Mek1/2 contributes to the emergence of the so-called salt and pepper pattern of exclusive PrE and EPI marker protein expression, that arises from initially uncommitted cells expressing both Nanog and the early PrE marker Gata6, at around the E3.5–E4.0 developmental window. Ultimately, the derived salt and pepper pattern resolves into the two segregated ICM lineages by the late-blastocyst (E4.5) stage. Alternatively, in EPI progenitors an insufficiency of p38-Mapk14/11 and Mek1/2 activating signalling (due to relatively reduced expression levels of Fgf- and Bmp-receptors) fails to block Nanog or induce required PrE-related gene expression, respectively. Consequently, Nanog levels remain high and PrE differentiation is resisted in favour of retention of pluripotency. This effect also augments the expression of secreted Bmp- and Fgf-related ligands that further reinforce the promotion of PrE differentiation of neighbouring receptive cells, in a paracrine manner.

References

    1. Rossant J, Tam PP. 2009. Blastocyst lineage formation, early embryonic asymmetries and axis patterning in the mouse. Development 136, 701–713. (doi:10.1242/dev.017178) - DOI - PubMed
    1. Schrode N, Xenopoulos P, Piliszek A, Frankenberg S, Plusa B, Hadjantonakis AK. 2013. Anatomy of a blastocyst: cell behaviors driving cell fate choice and morphogenesis in the early mouse embryo. Genesis 51, 219–233. (doi:10.1002/dvg.22368) - DOI - PMC - PubMed
    1. Zernicka-Goetz M, Morris SA, Bruce AW. 2009. Making a firm decision: multifaceted regulation of cell fate in the early mouse embryo. Nat. Rev. Genet. 10, 467–477. (doi:10.1038/nrg2564) - DOI - PubMed
    1. Sasaki H. 2015. Position- and polarity-dependent Hippo signaling regulates cell fates in preimplantation mouse embryos. Semin. Cell Dev. Biol. 48, 80–87. (doi:10.1016/j.semcdb.2015.05.003) - DOI - PubMed
    1. Nishioka N, Yamamoto S, Kiyonari H, Sato H, Sawada A, Ota M, Nakao K, Sasaki H. 2008. Tead4 is required for specification of trophectoderm in pre-implantation mouse embryos. Mech. Dev. 125, 270–283. (doi:10.1016/j.mod.2007.11.002) - DOI - PubMed

Publication types

Substances

LinkOut - more resources