

Absolute Measurement of Cardiac Injury-Induced microRNAs in Biofluids across Multiple Test Sites
- PMID: 27605421
- PMCID: PMC12129558
- DOI: 10.1093/toxsci/kfw143
Absolute Measurement of Cardiac Injury-Induced microRNAs in Biofluids across Multiple Test Sites
Abstract
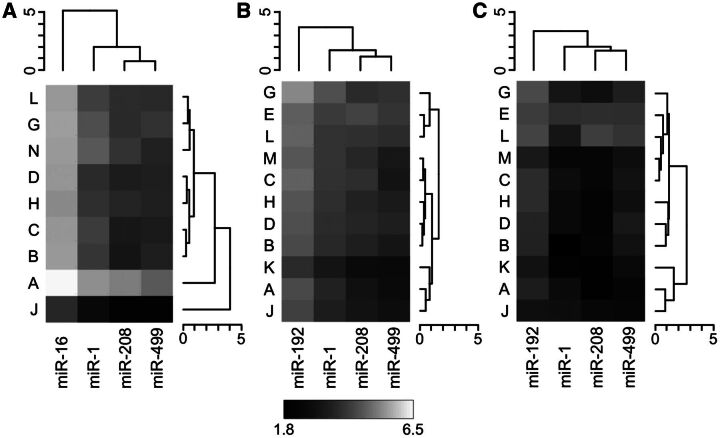
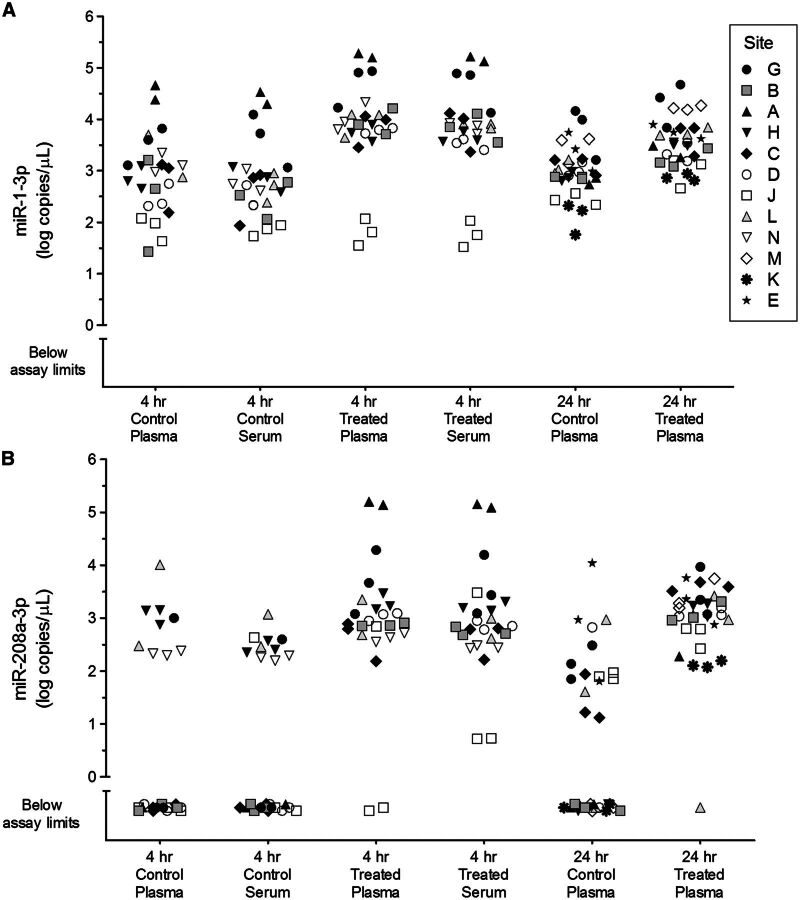
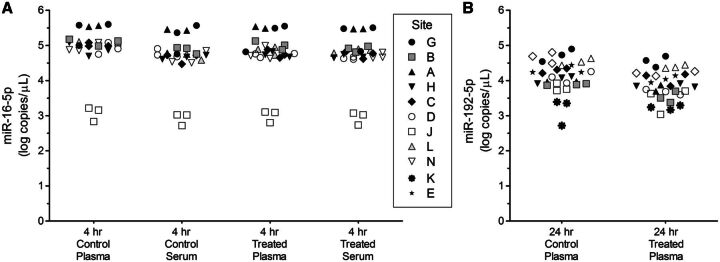
Extracellular microRNAs (miRNAs) represent a promising new source of toxicity biomarkers that are sensitive indicators of site of tissue injury. In order to establish reliable approaches for use in biomarker validation studies, the HESI technical committee on genomics initiated a multi-site study to assess sources of variance associated with quantitating levels of cardiac injury induced miRNAs in biofluids using RT-qPCR. Samples were generated at a central site using a model of acute cardiac injury induced in male Wistar rats by 0.5 mg/kg isoproterenol. Biofluid samples were sent to 11 sites for measurement of 3 cardiac enriched miRNAs (miR-1-3p, miR-208a-3p, and miR-499-5p) and 1 miRNA abundant in blood (miR-16-5p) or urine (miR-192-5p) by absolute quantification using calibration curves of synthetic miRNAs. The samples included serum and plasma prepared from blood collected at 4 h, urine collected from 6 to 24 h, and plasma prepared from blood collected at 24 h post subcutaneous injection. A 3 parameter logistic model was utilized to fit the calibration curve data and estimate levels of miRNAs in biofluid samples by inverse prediction. Most sites observed increased circulating levels of miR-1-3p and miR-208a-3p at 4 and 24 h after isoproterenol treatment, with no difference seen between serum and plasma. The biological differences in miRNA levels and sample type dominated as sources of variance, along with outlying performance by a few sites. The standard protocol established in this study was successfully implemented across multiple sites and provides a benchmark method for further improvements in quantitative assays for circulating miRNAs.
Keywords: biomarker; interlaboratory; microRNA; variance.
Published by Oxford University Press on behalf of the Society of Toxicology 2016. This work is written by US Government employees and is in the public domain in the US.
Figures


Similar articles
-
Paving the Route to Plasma miR-208a-3p as an Acute Cardiac Injury Biomarker: Preclinical Rat Data Supports Its Use in Drug Safety Assessment.Toxicol Sci. 2016 Jan;149(1):89-97. doi: 10.1093/toxsci/kfv222. Epub 2015 Oct 9. Toxicol Sci. 2016. PMID: 26454886
-
Serum outperforms plasma in small extracellular vesicle microRNA biomarker studies of adenocarcinoma of the esophagus.World J Gastroenterol. 2020 May 28;26(20):2570-2583. doi: 10.3748/wjg.v26.i20.2570. World J Gastroenterol. 2020. PMID: 32523312 Free PMC article.
-
Plasma microRNAs as potential new biomarkers for early detection of early gastric cancer.World J Gastroenterol. 2019 Apr 7;25(13):1580-1591. doi: 10.3748/wjg.v25.i13.1580. World J Gastroenterol. 2019. PMID: 30983818 Free PMC article.
-
Urinary MicroRNA-30c-5p and MicroRNA-192-5p as potential biomarkers of ischemia-reperfusion-induced kidney injury.Exp Biol Med (Maywood). 2017 Mar;242(6):657-667. doi: 10.1177/1535370216685005. Epub 2017 Jan 5. Exp Biol Med (Maywood). 2017. PMID: 28056546 Free PMC article.
-
Are circulating microRNAs peripheral biomarkers for Alzheimer's disease?Biochim Biophys Acta. 2016 Sep;1862(9):1617-27. doi: 10.1016/j.bbadis.2016.06.001. Epub 2016 Jun 2. Biochim Biophys Acta. 2016. PMID: 27264337 Free PMC article. Review.
Cited by
-
Absolute Quantification of Plasma MicroRNA Levels in Cynomolgus Monkeys, Using Quantitative Real-time Reverse Transcription PCR.J Vis Exp. 2018 Feb 12;(132):56850. doi: 10.3791/56850. J Vis Exp. 2018. PMID: 29553521 Free PMC article.
-
Urinary miRNA Biomarkers of Drug-Induced Kidney Injury and Their Site Specificity Within the Nephron.Toxicol Sci. 2021 Feb 26;180(1):1-16. doi: 10.1093/toxsci/kfaa181. Toxicol Sci. 2021. PMID: 33367795 Free PMC article.
-
Methodological considerations for measuring biofluid-based microRNA biomarkers.Crit Rev Toxicol. 2021 Mar;51(3):264-282. doi: 10.1080/10408444.2021.1907530. Epub 2021 May 26. Crit Rev Toxicol. 2021. PMID: 34038674 Free PMC article.
-
microRNAs Make the Call in Cancer Personalized Medicine.Front Cell Dev Biol. 2017 Sep 22;5:86. doi: 10.3389/fcell.2017.00086. eCollection 2017. Front Cell Dev Biol. 2017. PMID: 29018797 Free PMC article. Review.
-
Urinary MicroRNAs in Environmental Health: Biomarkers of Emergent Kidney Injury and Disease.Curr Environ Health Rep. 2020 Jun;7(2):101-108. doi: 10.1007/s40572-020-00271-8. Curr Environ Health Rep. 2020. PMID: 32166731 Free PMC article. Review.
References
-
- Adachi T. Nakanishi M. Otsuka Y. Nishimura K. Hirokawa G. Goto Y. Nonogi H. Iwai N. (2010). Plasma microRNA 499 as a biomarker of acute myocardial infarction. Clin.Chem 56, 1183–1185. - PubMed
-
- Akat K. M. Moore-McGriff D. Morozov P. Brown M. Gogakos T. Correa Da Rosa J. Mihailovic A. Sauer M. Ji R. Ramarathnam A., et al.. (2014). Comparative RNA-sequencing analysis of myocardial and circulating small RNAs in human heart failure and their utility as biomarkers. Proc. Natl. Acad. Sci. U S A 111, 11151–11156. - PMC - PubMed
-
- Bahnemann R. Jacobs M. Karbe E. Kaufmann W. Morawietz G. Nolte T. Rittinghausen S. (1988). Registry of Industrial Toxicology Animal-data. Guides for organ sampling and trimming procedures in rats. Exp. Toxic. Pathol. 47, 247–266. - PubMed
MeSH terms
Substances
LinkOut - more resources
Full Text Sources
Other Literature Sources
