. 2016 Dec 1;116(6):2523-2540.
doi: 10.1152/jn.00629.2016. Epub 2016 Sep 7.

Glycolysis selectively shapes the presynaptic action potential waveform

Affiliations

Glycolysis selectively shapes the presynaptic action potential waveform

Brendan Lujan et al. J Neurophysiol. .

Abstract

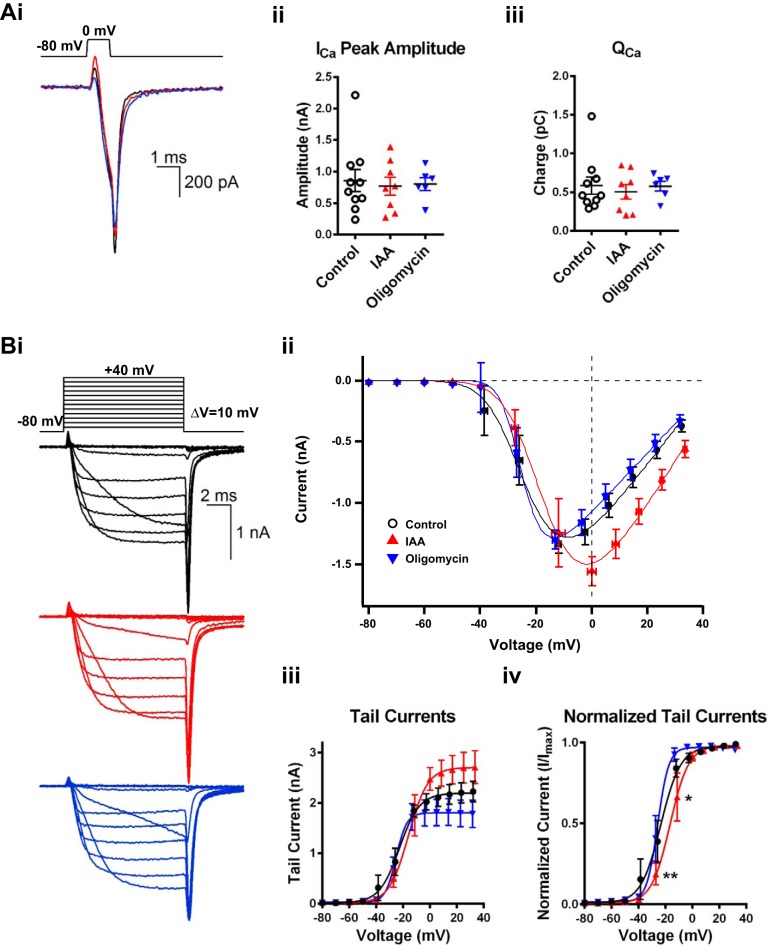
Mitochondria are major suppliers of cellular energy in neurons; however, utilization of energy from glycolysis vs. mitochondrial oxidative phosphorylation (OxPhos) in the presynaptic compartment during neurotransmission is largely unknown. Using presynaptic and postsynaptic recordings from the mouse calyx of Held, we examined the effect of acute selective pharmacological inhibition of glycolysis or mitochondrial OxPhos on multiple mechanisms regulating presynaptic function. Inhibition of glycolysis via glucose depletion and iodoacetic acid (1 mM) treatment, but not mitochondrial OxPhos, rapidly altered transmission, resulting in highly variable, oscillating responses. At reduced temperature, this same treatment attenuated synaptic transmission because of a smaller and broader presynaptic action potential (AP) waveform. We show via experimental manipulation and ion channel modeling that the altered AP waveform results in smaller Ca2+ influx, resulting in attenuated excitatory postsynaptic currents (EPSCs). In contrast, inhibition of mitochondria-derived ATP production via extracellular pyruvate depletion and bath-applied oligomycin (1 μM) had no significant effect on Ca2+ influx and did not alter the AP waveform within the same time frame (up to 30 min), and the resultant EPSC remained unaffected. Glycolysis, but not mitochondrial OxPhos, is thus required to maintain basal synaptic transmission at the presynaptic terminal. We propose that glycolytic enzymes are closely apposed to ATP-dependent ion pumps on the presynaptic membrane. Our results indicate a novel mechanism for the effect of hypoglycemia on neurotransmission. Attenuated transmission likely results from a single presynaptic mechanism at reduced temperature: a slower, smaller AP, before and independent of any effect on synaptic vesicle release or receptor activity.

Keywords: bioenergetics; calyx of Held; hypoglycemia; oxidative phosphorylation; stroke.


Figures

Fig. 1.
Fig. 1.
Inhibition of glycolysis does not regulate mitochondrial OxPhos in primary neurons. Inhibition of glycolysis by either IAA or 2-DGA suppresses ECARs without altering mitochondrial OxPhos OCRs in primary neurons. Ai: representative ECAR trace of primary cortical neurons exposed to 500 μM IAA or 100 mM 2-DGA for 1 h. Note that ECARs dropped to basal levels within 20 min after injection of glycolysis inhibitor. Aii: comparative analyses of ECARs at the 6th time point in Ai shows that both 500 μM IAA and 100 mM 2-DGA lead to a significant decrease in ECARs at RT. Data were compiled from 3 independent experiments. Bi: representative mitochondrial respiratory profile (oxygraph) demonstrates that treating primary neurons with 500 μM IAA or 100 mM 2-DGA at RT does not induce a significant drop in OCRs. This plot is representative of 1 of 3 experiments showing similar results. Bii: compiled quantification of OCRs normalized to protein content from 3 independent experiments. OCRs were measured at the 6th time point in Bi and were unaffected after IAA or 2-DGA treatment. *P < 0.05, ***P < 0.001.
Fig. 2.
Fig. 2.
Inhibition of mitochondrial OxPhos does not regulate glycolysis in primary neurons. Inhibition of mitochondrial OxPhos by oligomycin suppresses OCRs without altering glycolytic ECARs in primary neurons. Ai: representative ECAR trace of primary cortical neurons successively exposed to oligomycin (1 or 10 μM) and FCCP at RT. Aii: oligomycin does not have any effect on ECARs at either concentration. Data plot is a compiled quantification of ECARs normalized to protein content, taken at the 6th time point in Ai. Bi: representative OCR trace of primary cortical neurons sequentially exposed to oligomycin and FCCP at RT to measure baseline, ATP-linked, and maximal mitochondrial respiration, respectively. Bii: compiled quantification of OCRs normalized to protein content from 3 independent experiments. Oligomycin significantly inhibits OCRs within 10 min at both concentrations tested. **P < 0.01.
Fig. 3.
Fig. 3.
Inhibiting glycolysis, but not mitochondrial OxPhos, alters low-frequency neural activity at physiological temperature. EPSCs were evoked by midline stimulation at 0.1 Hz and recorded at PT from the principal cells of the MNTB from both P8-10 and P16-18 animals. The last 5 EPSCs at times indicated (control, 1; drug treatment, 2) were used for analysis and compared with pairwise t-test. A: inhibition with IAA + glucose-free ACSF quickly results in chaotic EPSC peak amplitudes. Ai: 2 example recordings (black and red markers) showing peak EPSC amplitude with stable baseline before application of glycolysis inhibitor IAA indicated by red line. Temperature was monitored during recording and plotted on right axis (gray and pink markers correspond to black and red markers, respectively). Aii: representative traces of control (black, time point 1) and OxPhos-only (red, time point 2) EPSC from the same cell (traces correspond to the cell represented as black markers in Ai). Aiii and Aiv: summarized data of peak EPSC amplitude before (baseline) and after treatment with IAA in prehearing (P8-10; Aiii) and hearing (P16-18; Aiv) animals. Av: EPSC variance (σ2) was measured using 20 responses at the same time points indicated in Ai, with both ages pooled. This analysis illustrates the significant increase in variability in response due to IAA. B: inhibition of mitochondrial OxPhos with oligomycin and pyruvate-free ACSF did not affect EPSC size. Bi: an example recording of EPSC peak amplitude vs. time. Stable baseline recording was achieved before bath application of OxPhos inhibitor oligomycin indicated by blue line. Temperature is plotted on right axis (gray markers) as in Ai. Bii: representative traces of control (black, time point 1) and oligomycin-treated (blue, time point 2) EPSCs demonstrate no change in EPSC peak amplitude. Biii and Biv: pairwise summarized data of control and oligomycin-treated EPSC peak amplitudes in both prehearing (Biii) and hearing (Biv) animals. Bv: EPSC variance was as in Av and resulted in no significant difference due to oligomycin treatment. *P < 0.05.
Fig. 4.
Fig. 4.
Inhibiting glycolysis, but not mitochondrial OxPhos, attenuates response at reduced temperature. EPSCs were recorded from the principal cells of the MNTB at room temperature (23°C). A: inhibition of glycolysis with IAA + glucose-free ACSF attenuated EPSC size. Ai: an example recording showing time course of IAA effect. Stable baseline was achieved in control conditions before bath application of glycolysis inhibitor IAA, indicated by red line. Peak EPSC amplitude is plotted against time. Aii: representative traces of control (black, time point 1) and OxPhos-only (red, time point 2) EPSCs from the same cell illustrate a loss of EPSC amplitude shortly after inhibition of glycolysis. Aiii and Aiv: pairwise summary data of control EPSC amplitudes and the effect of glycolysis inhibition in P8-10 (Aiii) and P16-18 (Aiv) animals. B: inhibition of mitochondrial OxPhos with oligomycin and pyruvate-free ACSF did not affect EPSC size. Bi: an example recording of EPSC peak amplitude including stable baseline before bath application of mitochondrial OxPhos inhibitor oligomycin (blue line). Bii: representative traces of EPSCs in control (black, time point 1) and glycolysis-only (blue, time point 2) conditions. Biii and Biv: pairwise summary of EPSC amplitudes recorded in control and after inhibition of OxPhos in prehearing (P8-10; Biii) and hearing (P16-18; Biv) animals. C: inhibition of both glycolysis and OxPhos resulted in transient increase in EPSC size, followed by loss of transmission. Ci: an example recording with stable baseline before bath application of IAA + oligomycin, indicated by green line. Cii: representative traces of the EPSCs in control (black, time point 1) and after inhibition of both glycolysis and OxPhos (green, time point 2) show a transient increase in evoked transmission. Time point 3 (brown) represents complete EPSC failure: note that data points are partially occluded by x-axis. Ciii: pairwise summary of EPSC amplitudes recorded in control and after inhibition of both glycolysis and OxPhos. IAA + oligomycin-treated cells revealed a significant increase in peak EPSC amplitude. Because the time course of drug effect on transmission was variable from cell to cell, time point 2 data represent the maximum % increase in EPSC amplitude after application of both drugs, within 30 min. *P < 0.05, **P < 0.01.
Fig. 5.
Fig. 5.
Spontaneous frequency is increased only in the absence of both glycolysis and mitochondrial respiration. Spontaneous EPSCs (sEPSCs) were recorded from the postsynaptic MNTB neuron before and after ∼30-min drug exposure. A: example recordings showing that sEPSCs were unaffected by treatment with either IAA or oligomycin. Application of both compounds increased sEPSC frequency. Representative traces during control baseline (black) and after drug treatment (red, blue, green) are shown. B: summary data comparing sEPSC amplitude before and after drug treatment in the same cells. sEPSC amplitude was unaffected in all conditions tested. C: summary data of sEPSC frequency. sEPSC frequency was unaffected by treatment with either IAA or oligomycin alone; however, application of both drugs together significantly increased sEPSC events. D: summary data of mean sEPSC decay time constants (τ); τ was unaffected in all conditions tested. 2-way ANOVA with correction for multiple comparisons was used for analysis in B–D. ***P < 0.001.
Fig. 6.
Fig. 6.
Resting levels of presynaptic Ca2+ are unaffected by loss of glycolysis or mitochondrial OxPhos but increase when both are inhibited. Genetically encoded Ca2+ indicator (GCaMP6m) was expressed selectively in the presynaptic terminal via rAAV, and basal Ca2+ levels were monitored when glycolysis or mitochondrial OxPhos was selectively blocked and when both modes of ATP production were inhibited. A: representative images of a presynaptic calyceal Ca2+ response during a strong stimulus (100 Hz, 500 ms; Ai), used to determine ROI of healthy calyx terminals, and at rest (Aii). ROIs identified in response to stimulation were used for basal Ca2+ measurements in the same slice, under quiescent (nonstimulated) conditions. B: time course of presynaptic Ca2+ measured during bath application of IAA, oligomycin, or IAA + oligomycin over 30 min. Loss of glycolysis or mitochondrial OxPhos independently did not alter presynaptic Ca2+ levels. However, inhibition of both metabolic pathways in concert resulted in a striking increase in presynaptic Ca2+. C: summary data of Ca2+ levels after drug incubation for 30 min shows an increase in presynaptic Ca2+ only after inhibition of both glycolysis and mitochondrial OxPhos. ***P < 0.001.
Fig. 7.
Fig. 7.
Presynaptic AP waveform is inhibited by loss of glycolytic ATP production. Action potentials were evoked by midline stimulation at 0.1 Hz and voltage recordings of the AP waveform made from the innervated calyx of Held presynaptic terminal. Holding current was maintained at 0 for all cells. A: representative APs from separate terminals in control conditions (black), when glycolysis was blocked with IAA (red) or zero glucose (gray), and after loss of mitochondrial OxPhos (blue). Stimulus artifacts were reduced by subtracting subthreshold waveforms. B: summary data of several AP parameters. Bi: presynaptic resting membrane potential (Vm) was depolarized in the presence of IAA or zero glucose. Oligomycin treatment had no effect on Vm. Bii: AP amplitude, measured as difference between baseline and AP peak, was reduced in the presence of IAA or zero glucose. Recordings in oligomycin were not different from controls. Biii: AP width at one-half peak height was significantly increased by IAA but unaffected by oligomycin. Zero glucose showed a nonsignificant increase in AP half-width. Biv: AP delay measured as time from stimulus delivery to AP peak was also increased by IAA and zero glucose but unaffected by oligomycin. *P < 0.05, **P < 0.01.
Fig. 8.
Fig. 8.
Presynaptic Ca2+ currents are altered after loss of glycolysis but not mitochondrial OxPhos. The presynaptic calyx of Held was voltage-clamped in whole cell configuration, held at −80 mV, and subjected to short depolarizations to measure Ca2+ channel activation and resulting current (ICa). A: action potential-like depolarization. Ai: presynaptic voltage clamp command waveform and example traces. Command voltage was stepped to 0 mV for 1 ms (top). Bottom: representative Ca2+ currents in control conditions (black) and in separate cells after treatment with IAA (red) or oligomycin (blue). Aii: peak ICa amplitude was not affected by IAA or oligomycin relative to control. Aiii: Ca2+ current charge (QCa, integral of trace) was also unaffected. B: step depolarizations (10-ms duration) were used to map Ca2+ current-voltage relationship. Bi: the terminal was stepped from −80 mV to +40 mV in 10-mV increments (top). Bottom: representative current families in control conditions (black) or after pretreatment with IAA (red) or oligomycin (blue). Bii: current-voltage relationship using peak Ca2+ current at 10 ms for control and after pretreatment with IAA or oligomycin. IAA resulted in larger currents at steps ≥ 0 mV, but the increase was not statistically significant (2-way ANOVA with correction for multiple comparisons; P = 0.71 at 0 mV, P = 0.15 at +10 mV). Biii: tail currents from 10-ms depolarizations showed no significant difference from control recordings. Biv: normalized tail currents fit by a Boltzmann function showed a rightward shift in activation due to IAA. *P < 0.05, **P < 0.01.
Fig. 9.
Fig. 9.
Modeling presynaptic Ca2+ current. Ca2+ currents were modeled with a Hodgkin-Huxley m2 model. A: Hodgkin-Huxley parameters for the modeling of presynaptic Ca2+ currents (see materials and methods). B: recorded Ca2+ current (black symbols) and simulated Ca2+ current (gray line) at matched command voltages after series resistance correction. Inset: example recorded (black) and simulated (gray) currents due to a 10-ms step depolarization to 10 mV. Simulated current is faster than recorded data because simulated output was not low-pass filtered. Scale bars: 1 nA, 5 ms. C: representative recorded AP waveforms (top) and the resulting Ca2+ current simulation (bottom) in control conditions (black) and after treatment with IAA (red) or oligomycin (blue). Simulated waveforms were filtered at 2.9 kHz and aligned on the AP rising phase for clarity. Simulated Ca2+ current showed reduced Qca and Ica in the presence of IAA but was unaffected by oligomycin treatment.
Fig. 10.
Fig. 10.
Ca2+ currents elicited by replaying recorded APs support IAA inhibition of AP-evoked ICa. IAA-mediated AP waveform results in a smaller ICa, experimentally validating predictions from the Ca2+ current simulation. A: previously recorded AP waveforms were used as voltage-command templates (top) during Ca2+ channel recordings from the calyx terminal. Bottom: resultant Ca2+ current traces induced by control (black), IAA (red), or oligomycin (blue) waveforms, in an example recording. All 3 currents were recorded from the same terminal. B: summary of effect of AP waveform shape on Ca2+ current peak (ICa) amplitudes (Bi) and current charge (QCa; Bii). Both peak ICa and QCa were significantly reduced by IAA AP waveform. *P < 0.05, **P < 0.01.
Fig. 11.
Fig. 11.
Restoring resting membrane potential only partially rescues AP waveform in the absence of presynaptic glycolysis. Combined simulation and experimental data suggest that both Na+ and K+ driving force are altered after inhibition of glycolysis. A: simulations from a Hodgkin-Huxley model used to predict the effect of altering Na+ reversal potential (ENa) and K+ reversal potential (EK) on AP waveform. Ai: varying ENa (50-18 mV) in the presence of fixed EK (−77 mV) predicts a decrease in AP amplitude and increase in AP delay. Aii: varying EK in the presence of fixed ENa (+50 mV) predicts reduced AP peak amplitude, as well as delay in AP spike initiation, and is accompanied by a loss of resting membrane potential (Vrest) as EK decreases. Aiii: fixing Vrest at −65 mV largely rescued the AP waveform shape, even in the presence of altered EK. B: AP voltage waveforms were recorded from the presynaptic calyx terminal, induced by midline stimulation at 0.1 Hz. Current injection was used to manipulate Vrest. Representative control (from Fig. 5, black dashed line, Ihold = 0) and IAA-treated APs recorded at corrected (red, Ihold = −400 pA) and depolarized (pink, Ihold = 0) resting membrane potentials. C: current injection corrects AP half-width when glycolysis is blocked. Ci: summary data showing the effect of membrane potential on AP half-width in the presence of IAA. Reduced membrane potential leads to a shorter AP half-width. Cii: AP half-width was rescued when resting potential was restored to control values (Vm = −87 mV). D: current injection corrects AP peak amplitude when glycolysis is blocked. Di: summary data showing the effect of membrane potential on AP peak amplitude in the presence of IAA. Reduced membrane potential leads to larger AP peak amplitude. Dii: AP peak amplitude was rescued when resting membrane potential was restored to control values (Vm = −87 mV). E: current injection does not correct AP delay due to inhibited glycolysis. Ei: summary data showing the effect of membrane potential on AP delay in the presence of IAA. No trend was observed between membrane potential and AP delay. Eii: the AP delay persisted when resting membrane potential was restored to control values (Vm = −87 mV) in the presence of IAA. *P < 0.05.

Similar articles

Cited by

References

    1. Alle H, Roth A, Geiger JR. Energy-efficient action potentials in hippocampal mossy fibers. Science 325: 1405–1408, 2009. - PubMed
    1. Ames A 3rd, Gurian BS. Effects of glucose and oxygen deprivation on function of isolated mammalian retina. J Neurophysiol 26: 617–634, 1963. - PubMed
    1. Awatramani GB, Price GD, Trussell LO. Modulation of transmitter release by presynaptic resting potential and background calcium levels. Neuron 48: 109–121, 2005. - PubMed
    1. Bak LK, Schousboe A, Sonnewald U, Waagepetersen HS. Glucose is necessary to maintain neurotransmitter homeostasis during synaptic activity in cultured glutamatergic neurons. J Cereb Blood Flow Metab 26: 1285–1297, 2006. - PubMed
    1. Bak LK, Walls AB, Schousboe A, Ring A, Sonnewald U, Waagepetersen HS. Neuronal glucose but not lactate utilization is positively correlated with NMDA-induced neurotransmission and fluctuations in cytosolic Ca2+ levels. J Neurochem 109: 87–93, 2009. - PubMed

Publication types

MeSH terms

LinkOut - more resources