. 2016 Sep 7;8(355):355ra118.
doi: 10.1126/scitranslmed.aad9823.

Heat shock protein-based therapy as a potential candidate for treating the sphingolipidoses

Affiliations

Heat shock protein-based therapy as a potential candidate for treating the sphingolipidoses

Thomas Kirkegaard et al. Sci Transl Med. .

Abstract

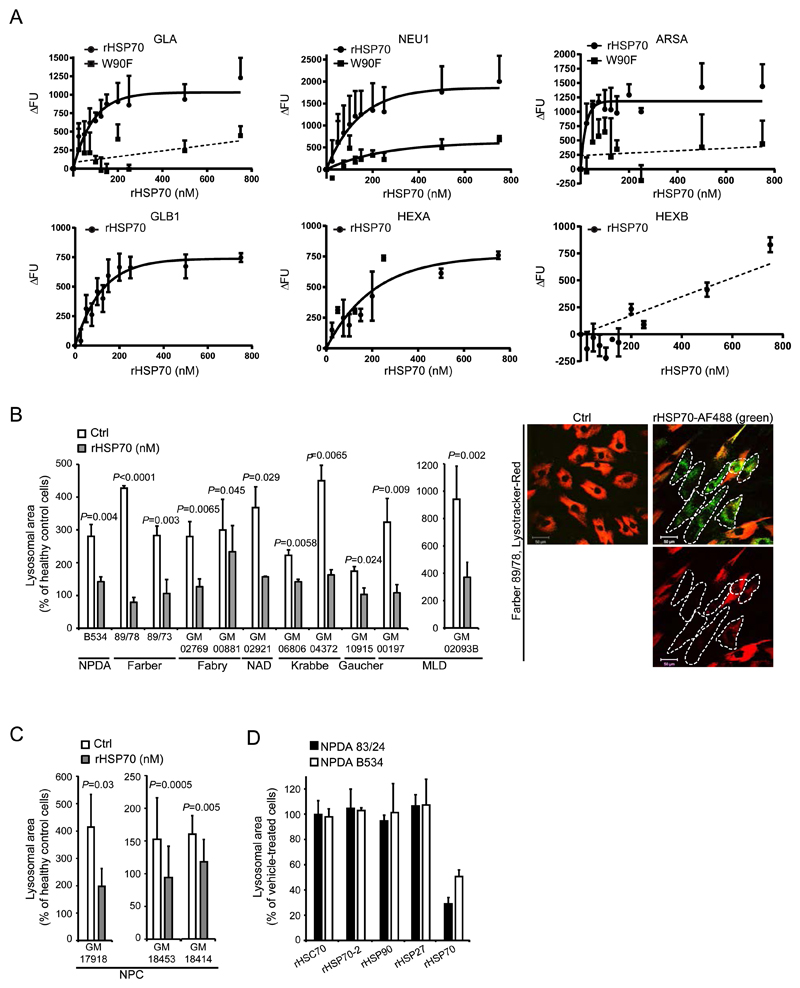
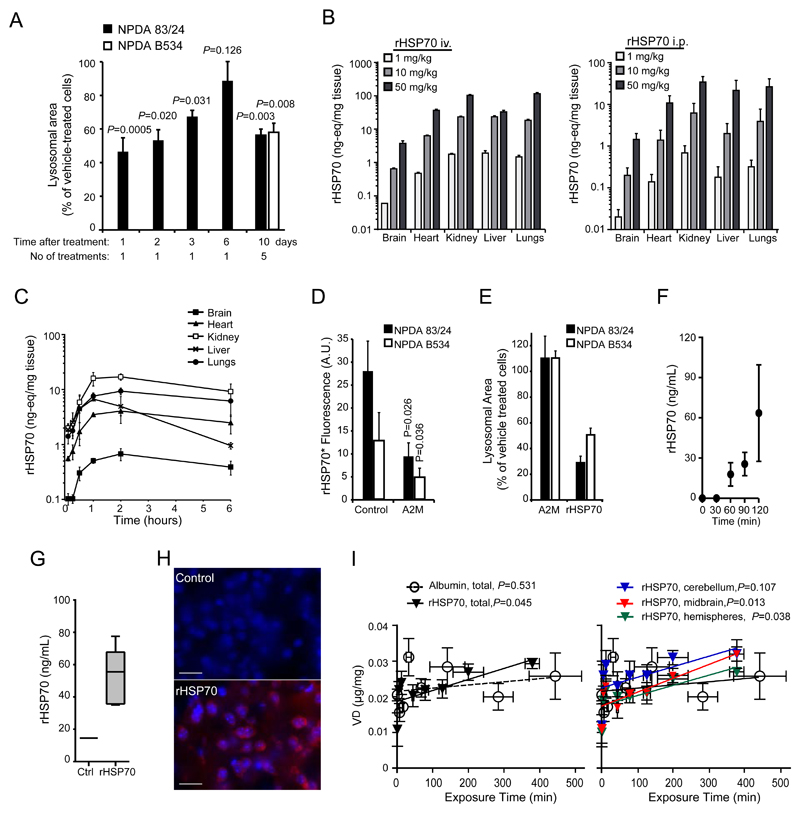
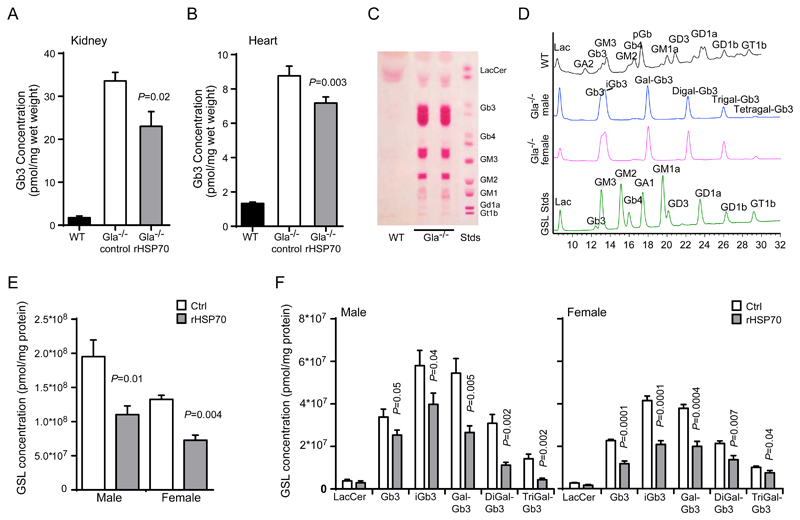
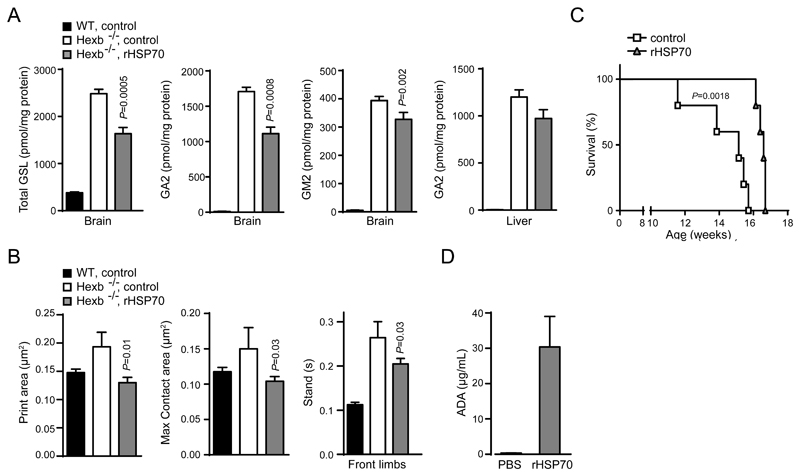
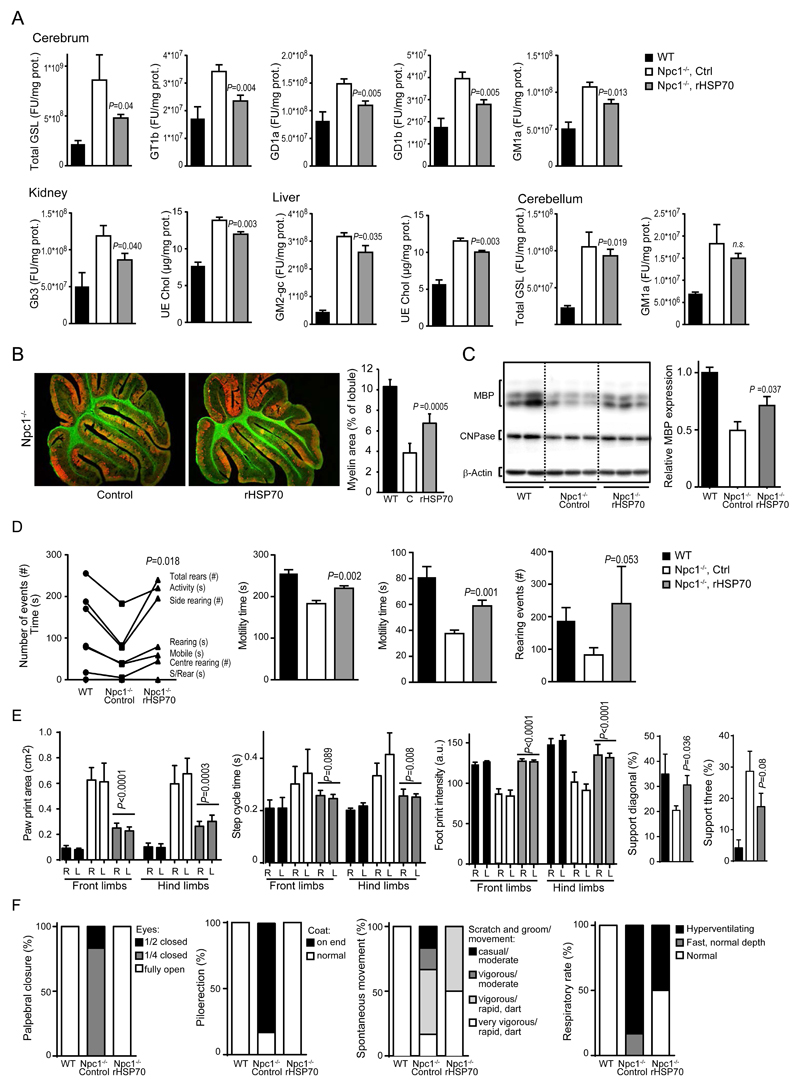
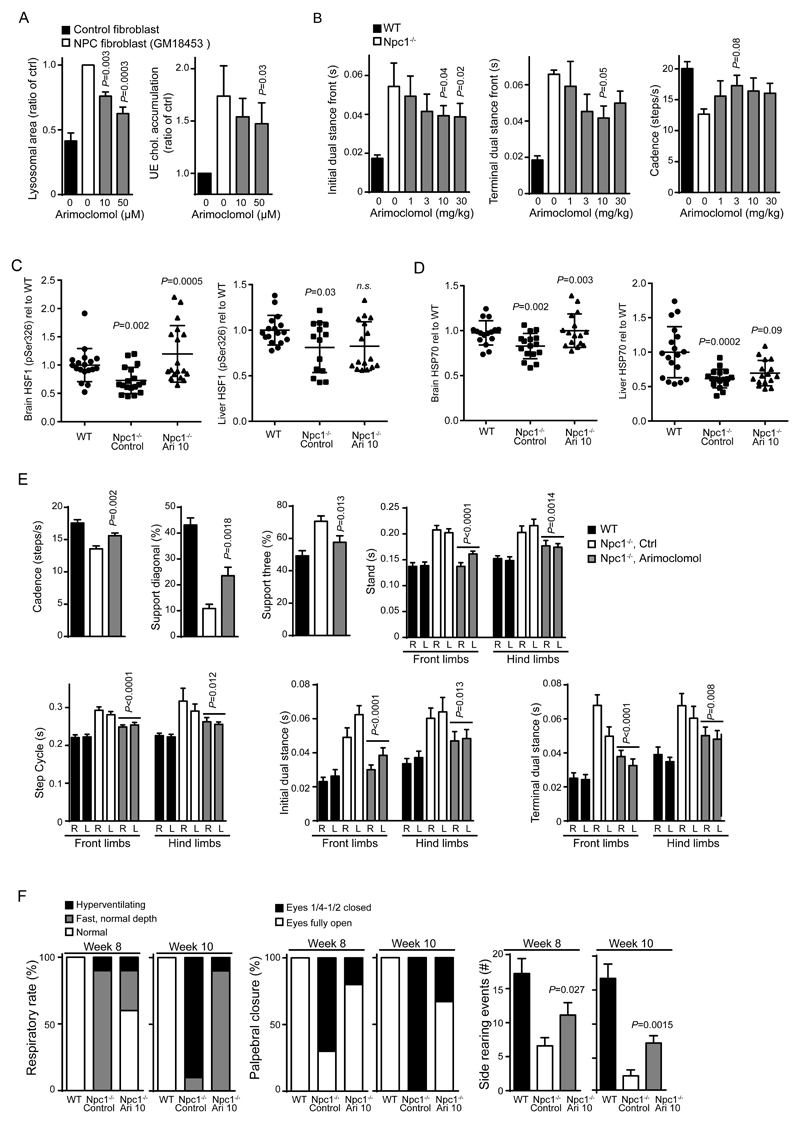
Lysosomal storage diseases (LSDs) often manifest with severe systemic and central nervous system (CNS) symptoms. The existing treatment options are limited and have no or only modest efficacy against neurological manifestations of disease. We demonstrate that recombinant human heat shock protein 70 (HSP70) improves the binding of several sphingolipid-degrading enzymes to their essential cofactor bis(monoacyl)glycerophosphate in vitro. HSP70 treatment reversed lysosomal pathology in primary fibroblasts from 14 patients with eight different LSDs. HSP70 penetrated effectively into murine tissues including the CNS and inhibited glycosphingolipid accumulation in murine models of Fabry disease (Gla(-/-)), Sandhoff disease (Hexb(-/-)), and Niemann-Pick disease type C (Npc1(-/-)) and attenuated a wide spectrum of disease-associated neurological symptoms in Hexb(-/-) and Npc1(-/-) mice. Oral administration of arimoclomol, a small-molecule coinducer of HSPs that is currently in clinical trials for Niemann-Pick disease type C (NPC), recapitulated the effects of recombinant human HSP70, suggesting that heat shock protein-based therapies merit clinical evaluation for treating LSDs.


Conflict of interest statement

Competing interests T.K. and M.J. hold shares in Orphazyme. T.K. and M.J. are inventors on patents related to this work: PCT/DK2009/050151 “Use of Hsp70 protein or Small Molecule inducers of heat shock proteins, including Hsp70, for the treatment of lysosomal storage disorders (LSD)”; PCT/DK2011/050444 “Use of Hsp70 protein or Small Molecule Hsp inducers for the treatment of additional lysosomal storage disorders (LSD).” D.B. is a consultant for Alexion and Cyclodextrin Technology Development Holdings. F.P. is a consultant for Orphazyme and Actelion.

Figures

Figure 1
Figure 1. Effects of rHsp70 treatment in vitro
(A) Analysis of rHSP70’s effect on the lipid cofactor Bis(monoacyl)glycerophosphate (BMP)-binding interactions of sphingolipid-catabolic enzymes (GLA, NEU1, ARSA, GLB1, HEXA and HEXB). Data points and association curves (non-linear regression, assuming one-phase association) are depicted on all graphs for rHSP70 except for HEXB (no curve-fit). For GLA, NEU1 and ARSA the effect of the Trp90Phe point mutation in HSP70 (W90F) lacking the capacity to interact with BMP was also analysed. Only for NEU1 could a one-phase association curve be fitted. For ARSA and GLA the signal was too weak to establish any meaningful regression (linear regression shown as a guide). (B) Quantification of lysosomal area in confocal cross sections of primary fibroblasts from patients with different lysosomal storage diseases, either sham-treated (Vehicle) or treated for 24h with 300nM rHSP70. The representative microscopic images on the right show the effect of 24h rHSP70 (green) treatment on the volume of the lysosomal compartment (red) in fibroblasts from a patient with Farber disease. White dotted lines indicate the positions of cells with endocytosed rHSP70. Scale bar 50μm. (C) Quantification of lysosomal area of confocal cross sections of primary patient fibroblasts from patients with Niemann-Pick type C disease, either sham-treated (Vehicle) or treated for 24h with 300nM rHSP70. (D) Quantification of lysosomal area of confocal cross sections of primary patient fibroblasts from two Niemann-Pick type A patients treated with 300nM of the indicated recombinant proteins for 24h. (A) The individual values represent the mean of three independent experiments, P ≤ 0.05. (B-D) All values represent mean ± S.D. for a minimum of three independent experiments. A minimum of 100 cells were analyzed for each independent experiment P ≤ 0.05. Two-sample comparisons were performed by employing Student’s t-test, multiple comparisons were analysed by one-way ANOVA followed by Dunnet’s multiple comparison test. BMP: Bis(monoacyl)glycerophosphate, GLA: alpha-Galactosidase A, NEU1: Neuraminidase 1, ARSA: Arylsulfatase, GLB1: beta-galactosidase, HEXA: Hexosaminidase A, HEXB: Hexosaminidase B
Figure 2
Figure 2. Pharmacokinetics and distribution of rHSP70
(A) Quantification of lysosomal area in confocal cross sections from primary fibroblasts from a Niemann-Pick type A patient (83/24), treated with 300nM rHSP70 for 24h followed by a chase period of 1, 2, 3 or 6 days. Quantification of lysosomal area of confocal cross sections from primary fibroblasts from two Niemann-Pick type A patients at the end of a series of repeated exposures to 300nM rHSP70 for 24h once weekly for 5 weeks total P ≤ 0.01. Two-sample comparisons were performed by employing Student’s t-test, (B) Dose dependence of tissue distribution after administration of 1, 10 or 50 mg/kg [125I]-rHSP70 for 15min (I.V.) or 60 min (I.P.), n=3 per dose, values represent mean ± S.D. (C) Time dependence of tissue distribution after intraperitoneal administration of 10 mg/kg [125I]-rHSP70, n=3 per timepoint, values represent mean ± S.D. (D) Analysis of the effect of the LRP-1 ligand alpha-2-macroglobulin (A2M) on the receptor-mediated uptake of rHSP70. P ≤ 0.05. Two-sample comparisons were performed by employing Student’s t-test, (E) Quantification of lysosomal area of confocal cross sections from primary fibroblasts from two NPDA patients, either treated with 300nM A2M or rHSP70 for 24h. (F) The effect of 10 mg/kg intravenously administered rHSP70 on free HSP70 levels in the striatum of adult male Wistar rat brains. rHSP70 was infused from t=0; n=4, values represent mean ± S.D. (G) Amount of rHSP70 in adult male Wistar rat brain following i.v. administration of 10 mg/kg rHSP70 for 120 min followed by saline perfusion and capillary spin-down; n=6 for rHSP70 treated, n=1 for saline infusion control. Box and whisker plot depicts minimum to maximum. (H) Immunohistochemical analysis of cortical sections from Npc1-/- mice administered PBS (Control) or rHSP70 (3mg/kg, I.P., 3x/week) for 4 weeks. Scale bar=25μM (I) Patlak plots (multiple time regression analysis) of the volume of distribution for i.v. injected 20mg/kg [3H]-albumin or [3H]-rHSP70 against the plasma area under the curve in either whole brain (left graph) or cerebellum, midbrain or left and right hemispheres (right graph), n=4-7 mice per timepoint.
Figure 3
Figure 3. rHSP70 efficacy in the Gla-/- mouse model of Fabry disease
(A,B) Quantification of globotriaosylceramide (Gb3) extracted from kidney (A) and heart (b) of wildtype (WT), vehicle (PBS) control (Gla-/-, ctrl)- or rHSP70-treated (Gla-/-, rHSP70) mice at 17 weeks of age.. (C, D) Analysis of the glycosphingolipid (GSL) storage profile of dorsal root ganglia from Gla-/- mice by thin-layer chromatography (TLC) (C) and high-pressure liquid chromatography (HPLC) (D). (E-F) Quantification of glycosphingolipid species extracted from dorsal root ganglia of wildtype (WT), vehicle (PBS) control (Gla-/-, ctrl) or rHSP70-treated (Gla-/-, rHSP70) mice at week 12. Gla-/- mice were treated with 5mg/kg rHSP70 or vehicle (PBS) control, I.P., 3x/week from week 3 (after weaning) until euthanasia at 12 weeks of age. Values represent mean ± SEM.; n=4-6 for WT, n=5-8 for control Gla-/- mice, n=8 for rHSP70-treated Gla-/-mice. P ≤ 0.05. Two-sample comparisons were performed by employing Student’s t-test, multiple comparisons were analysed by one-way ANOVA followed by Dunnet’s multiple comparison test.
Figure 4
Figure 4. rHSP70 efficacy in the HexB-/- mouse model of Sandhoff disease
(A) Quantification of glycosphingolipids (GSL) in the brain and liver of WT control, Hexb-/- untreated and Hexb-/- mice treated with human rHSP70. P ≤ 0.001. Two-sample comparisons were performed by employing Student’s t-test; multiple comparisons were analysed by one-way ANOVA followed by Dunnet’s multiple comparison test. (B) Automated gait analysis by Noldus Catwalk XT system of wildtype (WT), vehicle (PBS) control (Hexb-/-, ctrl) and rHSP70-treated (Hexb-/-, rHSP70) mice at 12 weeks of age. (C) Kaplan-Meier survival curves of control and rHSP70-treated Hexb-/- mice. P ≤ 0.01. Two-sample comparisons were performed by employing Student’s t-test. (D) Assay of antidrug antibody (ADA) response. Hexb-/- mice were treated with 5mg/kg rHSP70 or vehicle (PBS) control, I.P., 3x/week from week 3 (after weaning) until euthanasia at week 12 (biochemical analysis) or until reaching the predefined humane endpoint for survival defined as inability to right themselves when laid on the side. Values represent mean ± SEM. n=10 for behavioral analysis, n= 5 for biochemistry, n=5 for survival.
Figure 5
Figure 5. rHSP70 efficacy in the Npc1-/- mouse model of Niemann-Pick type C disease
(A) Glycosphingolipid (GSL) species and unesterified cholesterol extracted from brains, kidney and liver of wildtype (WT), vehicle (PBS) control (Npc1-/-, ctrl) and rHSP70-treated (Npc1-/-, rHSP70) Npc1-/- mice at postnatal day 54 (P54). Npc1-/-mice were treated with 3mg/kg rHSP70 or vehicle (PBS) control, I.P., 3x/week from P21 to P53. Values represent mean ± SEM; n=5 for WT and Npc1-/-, n=6 for rHSP70-treated. P ≤ 0.05. Two-sample comparisons were performed by employing Student’s t-test; multiple comparisons were analysed by one-way ANOVA followed by Dunnet’s multiple comparison test.(B) Representative images and quantifications of cerebellar sections of wildtype (WT), vehicle (PBS) control (Npc1-/-, ctrl) or rHSP70-treated (Npc1-/-, rHSP70) Npc1-/- mice at P54 showing Purkinje cells labeled with calbindin (red) and white matter/myelin labeled with cholera toxin (ChTx, green). Image quantification of myelin content normalized to lobular area is presented in the graph to the right, wildtype (WT), C (Control, PBS-treated), rHSP70 (rHSP70-treated). n=5-6; values represent mean ± S.D. (C) Western blot and densitometric quantification of cerebellar Myelin Basic Protein (MBP) expression relative to WT expression normalized to β-actin. n=4 for WT, n=5 for Npc1-/- control and n=6 for rHSP70-treated Npc1-/- mice. Values represent mean ± SEM. (D) Automated open field analysis (Amlogger system) of behavior of wildtype (WT, control), vehicle (PBS) control (Npc1-/-, ctrl) or rHSP70-treated (Npc1-/-, rHSP70) Npc1-/- mice at postnatal day 47 to 51 (P47-51). Npc1-/- mice were treated with 3mg/kg rHSP70 or vehicle (PBS) control, I.P., 3x/week from P21, n=6, values represent mean ± SEM. P ≤ 0.05. Two-sample comparisons were performed by employing Student’s t-test. (E) Quantification of automated gait analysis (Noldus Catwalk XT system) of wildtype (WT, control), vehicle (PBS) control (Npc1-/-, ctrl) or rHSP70-treated (Npc1-/-, rHSP70) Npc1-/- mice at P49-52. Npc1-/- mice were treated with 3mg/kg rHSP70 or vehicle (PBS) control, I.P., 3x/week from P21, n=3 for WT, n=5 for Ctrl and n=6 for rHSP70-treated. Values represent mean ± SEM. P ≤ 0.05 for all measurements except step cycle (front), P=0.089 and Support (three) P=0.08. Two-sample comparisons were performed by employing Student’s t-test (F) SHIRPA analysis of behavioral and neurological manifestations of disease in wildtype (WT, control), vehicle (PBS) control (Npc1-/-, ctrl) or rHSP70-treated (Npc1-/-, rHSP70) Npc1-/- mice at 7 weeks of age. Npc1-/- mice were treated with 3mg/kg rHSP70 or vehicle (PBS) control, I.P., 3x/week from P21, n=10 for all groups.
Figure 6
Figure 6. Arimoclomol treatment and its effects on lysosomal storage and neurological symptoms in the Npc1-/- mouse model of Niemann-Pick type C disease
(A) Analysis of lysosomal accumulation (left) and storage of unesterified cholesterol (right) in primary fibroblasts from NPC patients with the I1061T/I1061T haplotype treated with increasing doses of arimoclomol for 24h. P ≤ 0.01, P ≤ 0.05, respectively. Data were analysed by one-way ANOVA followed by Dunnet’s multiple comparison test.. (B) Quantification of automated gait analysis for arimoclomol-treated Npc1-/- mice over a 1-30mg/kg dose-range. Mice were administered different concentrations of arimoclomol daily in drinking water from 3 weeks of age until analysis at 7 weeks of age, values represent mean ± SEM P ≤ 0.05. Two-sample comparisons were performed by employing Student’s t-test; multiple comparisons were analysed by one-way ANOVA followed by Dunnet’s multiple comparison test. (C) Analysis of activated HSF1 (pSer326 HSF1) by ELISA in brains and livers of wildtype (WT), control (Npc1-/-, control) or arimoclomol-treated (Npc1-/-, Ari 10) Npc1-/- mice at 7 weeks of age. Npc1-/- mice were treated with 10mg/kg arimoclomol daily in drinking water or sham (water alone) control from three to seven weeks of age, n=16-18 per group. P-values denote NPC control vs WT and NPC Ari 10 vs NPC control, respectively. Bars represent average +/- SD P ≤ 0.01 for brain. Two-sample comparisons were performed by employing Student’s t-test. (D) Analysis of Hsp70 by ELISA in brains and livers of wildtype (WT), control (Npc1-/-, control) or arimoclomol-treated (Npc1-/-, Ari 10) Npc1-/- mice at 7 weeks of age. Npc1-/- mice were treated with 10mg/kg arimoclomol daily in drinking water or sham (water only) as control from three to seven weeks of age, N=16-18 per group. P values denote NPC control vs WT and NPC Ari 10 vs NPC control, respectively. Bars represent average +/- SD P ≤ 0.01 for brain. Two-sample comparisons were performed by employing Student’s t-test. (E) Quantification of automated gait analysis of wildtype (WT), control (Npc1-/-, ctrl) or arimoclomol-treated (Npc1-/-, arimoclomol) Npc1-/- mice at 7 weeks of age. Npc1-/- mice were treated with 10mg/kg arimoclomol daily in drinking water from three to seven weeks of age or sham (water only) control. Values represent mean ± SEM, n=10 per group. P ≤ 0.01. Two-sample comparisons were performed by employing Student’s t-test. (F) SHIRPA analysis of behavioral and neurological manifestations of disease in wildtype (WT), control (Npc1-/-, ctrl) or arimoclomol-treated (Npc1-/-, ari 10) Npc1-/- mice at 7 weeks of age. Npc1-/- mice were treated with 10mg/kg arimoclomol daily in drinking water or sham (water only) control from three to ten weeks of age, n=10 per group.

Comment in

References

    1. Parenti G, Andria G, Ballabio A. Lysosomal Storage Diseases: From Pathophysiology to Therapy. Annu Rev Med. 2015;66:471–486. - PubMed
    1. Xu Y-H, Barnes S, Sun Y, Grabowski Ga. Multi-system disorders of glycosphingolipid and ganglioside metabolism. J Lipid Res. 2010;51:1643–1675. - PMC - PubMed
    1. Neef DW, Jaeger AM, Thiele DJ. Heat shock transcription factor 1 as a therapeutic target in neurodegenerative diseases. Nat Rev Drug Discov. 2011;10:930–44. - PMC - PubMed
    1. Muchowski PJ, Wacker JL. Modulation of neurodegeneration by molecular chaperones. Nat Rev Neurosci. 2005;6:11–22. - PubMed
    1. Kieran D, Kalmar B, Dick JRT, Riddoch-Contreras J, Burnstock G, Greensmith L. Treatment with arimoclomol, a coinducer of heat shock proteins, delays disease progression in ALS mice. Nat Med. 2004;10:402–405. - PubMed

MeSH terms