. 2016 Sep 7;36(36):9326-41.
doi: 10.1523/JNEUROSCI.0958-16.2016.

Combined Pharmacological and Genetic Manipulations Unlock Unprecedented Temporal Elasticity and Reveal Phase-Specific Modulation of the Molecular Circadian Clock of the Mouse Suprachiasmatic Nucleus

Affiliations

Combined Pharmacological and Genetic Manipulations Unlock Unprecedented Temporal Elasticity and Reveal Phase-Specific Modulation of the Molecular Circadian Clock of the Mouse Suprachiasmatic Nucleus

Andrew P Patton et al. J Neurosci. .

Abstract

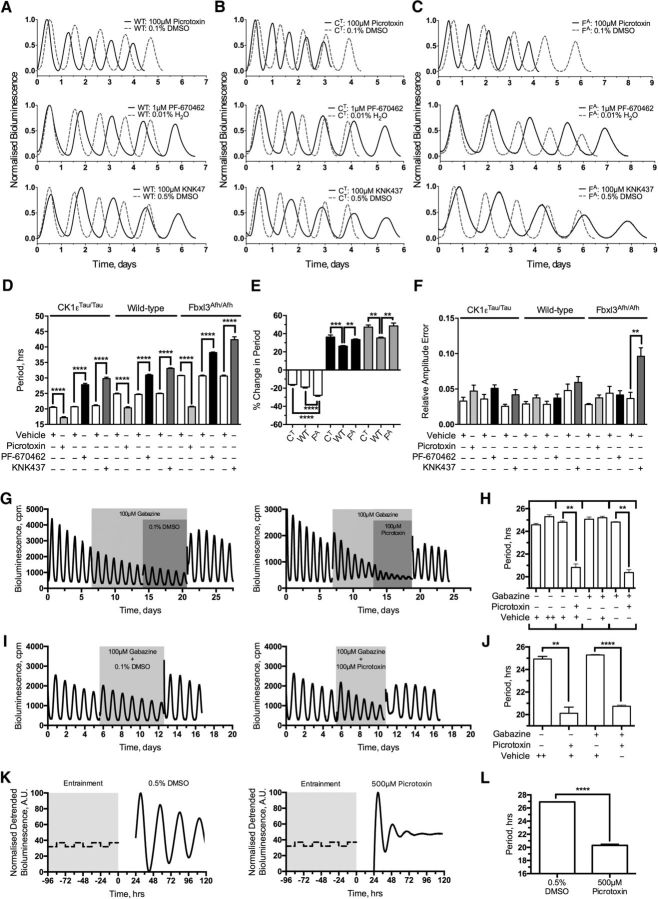
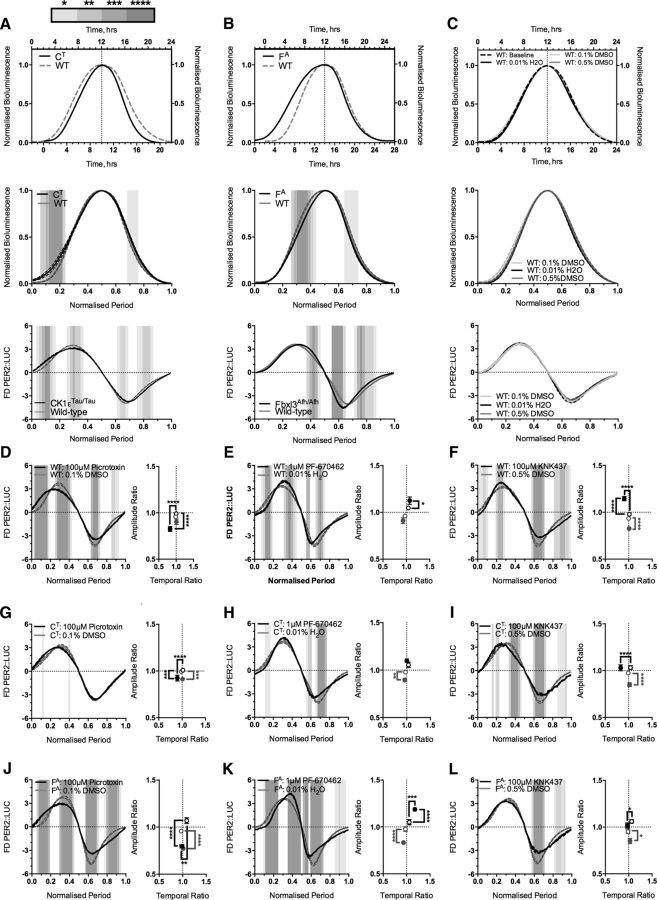
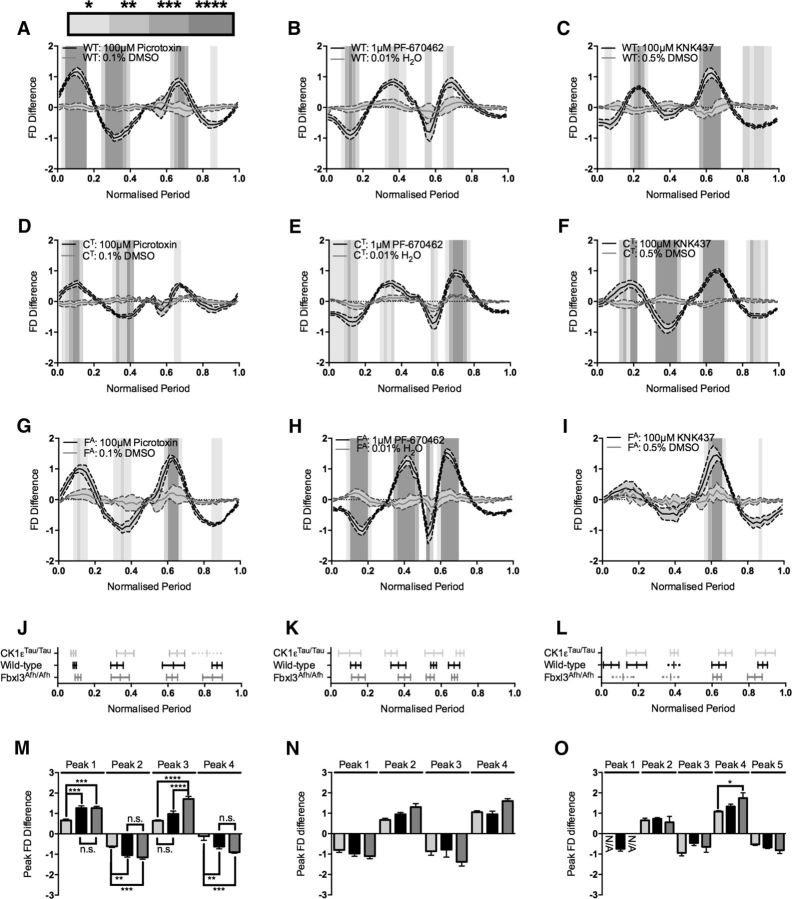
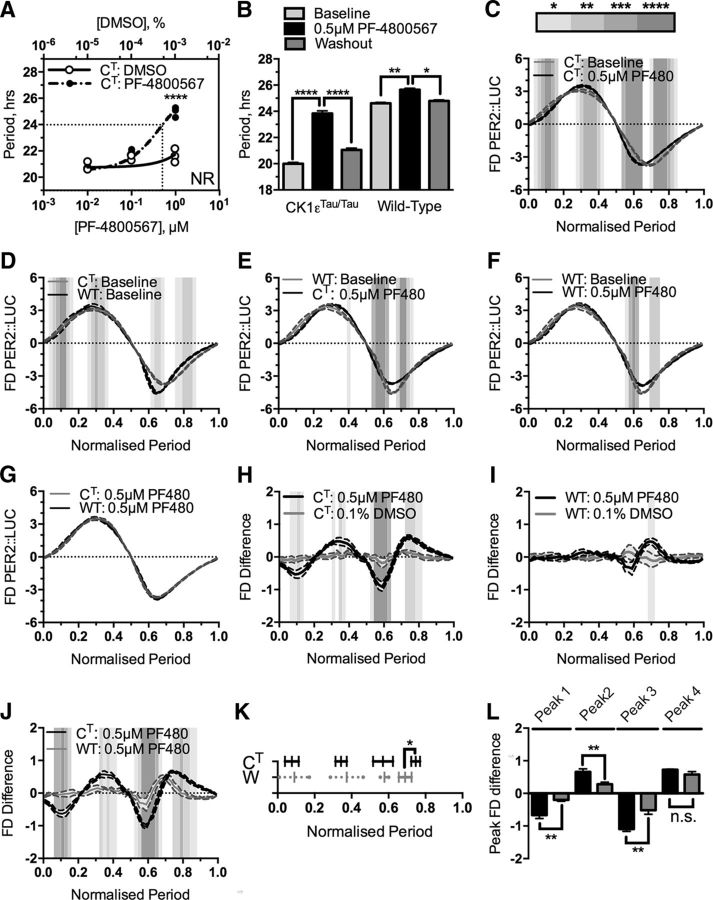
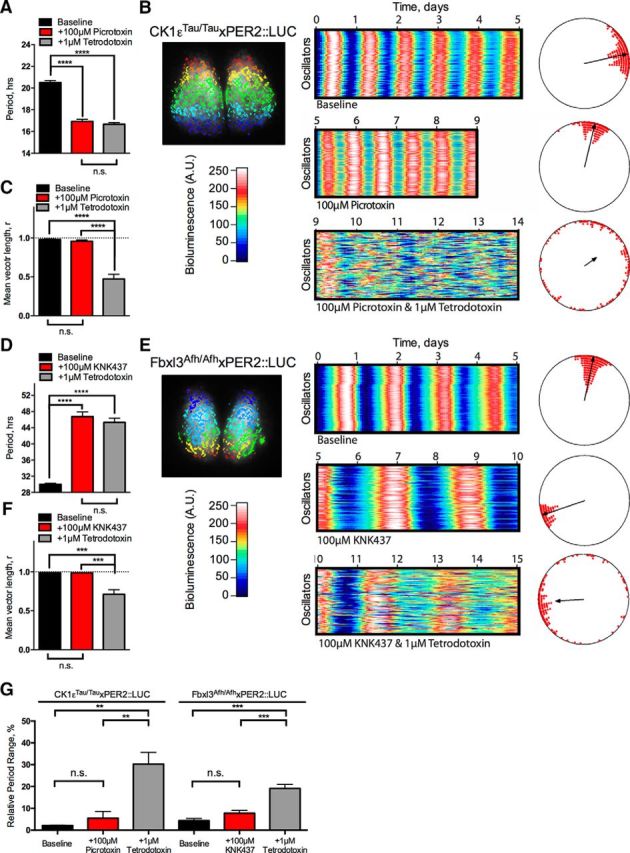
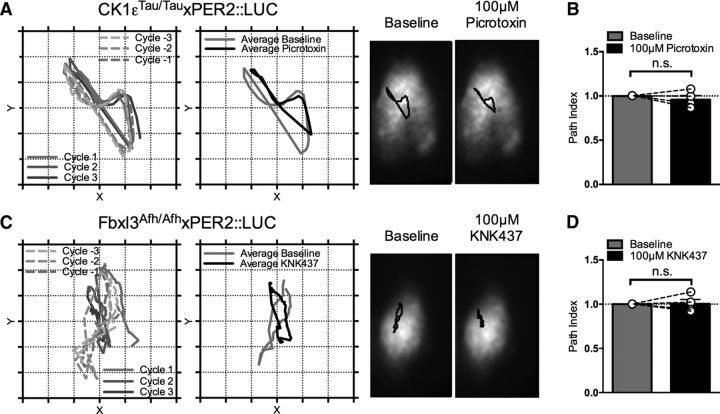
The suprachiasmatic nucleus (SCN) is the master circadian oscillator encoding time-of-day information. SCN timekeeping is sustained by a cell-autonomous transcriptional-translational feedback loop, whereby expression of the Period and Cryptochrome genes is negatively regulated by their protein products. This loop in turn drives circadian oscillations in gene expression that direct SCN electrical activity and thence behavior. The robustness of SCN timekeeping is further enhanced by interneuronal, circuit-level coupling. The aim of this study was to combine pharmacological and genetic manipulations to push the SCN clockwork toward its limits and, by doing so, probe cell-autonomous and emergent, circuit-level properties. Circadian oscillation of mouse SCN organotypic slice cultures was monitored as PER2::LUC bioluminescence. SCN of three genetic backgrounds-wild-type, short-period CK1ε(Tau/Tau) mutant, and long-period Fbxl3(Afh/Afh) mutant-all responded reversibly to pharmacological manipulation with period-altering compounds: picrotoxin, PF-670462 (4-[1-Cyclohexyl-4-(4-fluorophenyl)-1H-imidazol-5-yl]-2-pyrimidinamine dihydrochloride), and KNK437 (N-Formyl-3,4-methylenedioxy-benzylidine-gamma-butyrolactam). This revealed a remarkably wide operating range of sustained periods extending across 25 h, from ≤17 h to >42 h. Moreover, this range was maintained at network and single-cell levels. Development of a new technique for formal analysis of circadian waveform, first derivative analysis (FDA), revealed internal phase patterning to the circadian oscillation at these extreme periods and differential phase sensitivity of the SCN to genetic and pharmacological manipulations. For example, FDA of the CK1ε(Tau/Tau) mutant SCN treated with the CK1ε-specific inhibitor PF-4800567 (3-[(3-Chlorophenoxy)methyl]-1-(tetrahydro-2H-pyran-4-yl)-1H-pyrazolo[3,4-d]pyrimidin-4-amine hydrochloride) revealed that period acceleration in the mutant is due to inappropriately phased activity of the CK1ε isoform. In conclusion, extreme period manipulation reveals unprecedented elasticity and temporal structure of the SCN circadian oscillation.

Significance statement: The master circadian clock of the suprachiasmatic nucleus (SCN) encodes time-of-day information that allows mammals to predict and thereby adapt to daily environmental cycles. Using combined genetic and pharmacological interventions, we assessed the temporal elasticity of the SCN network. Despite having evolved to generate a 24 h circadian period, we show that the molecular clock is surprisingly elastic, able to reversibly sustain coherent periods between ≤17 and >42 h at the levels of individual cells and the overall circuit. Using quantitative techniques to analyze these extreme periodicities, we reveal that the oscillator progresses as a sequence of distinct stages. These findings reveal new properties of how the SCN functions as a network and should inform biological and mathematical analyses of circadian timekeeping.

Keywords: FBXL3; bioluminescence; casein kinase; organotypic slice; period; picrotoxin.


Figures

Figure 1.
Figure 1.
Genetic and pharmacological manipulation of the SCN period greatly extends the operational range of explant SCN slices. A–C, Example PMT traces showing normalized bioluminescence for treatment intervals. Treatments are as follows: 100 μm picrotoxin/0.1% DMSO (top), 1 μm PF-670462/0.01% H2O (middle), and 100 μm KNK437/0.5% DMSO (bottom). Treatment (solid black) is overlaid with vehicle traces (dashed gray) grouped by genotype. A, Wild-type PER2::LUC (WT). B, CK1εTau/Tau × PER2::LUC (CT). C, Fbxl3Afh/Afh × PER2::LUC (FA). D, Summary period data expressed as mean ± SEM from each treatment condition grouped by genotype. Treatments accompanied by their specific vehicles (white) are 100 μm picrotoxin (light gray), 1 μm PF-670462 (black), and 100 μm KNK437 (dark gray), as indicated. E, Summary data expressing the proportional change in period expressed the percentage change from baseline period induced by period-altering compounds and expressed as mean ± SEM. Bars are grouped by pharmacological treatment: 100 μm picrotoxin (white), 1 μm PF-670462 (black), and 100 μm KNK437 (gray). Genotypes are identified as CK1εTau/Tau×PER2::LUC, wild-type PER2::LUC (WT) and Fbxl3Afh/Afh × PER2::LUC. F, Summary RAE expressed as mean ± SEM from each condition grouped by genotype. Treatments accompanied by their specific vehicles (white) are 100 μm picrotoxin (light gray), 1 μm PF-670462 (black), and 100 μm KNK437 (dark gray), as indicated. G, Example PMT traces for continuous wild-type SCN explant experiments cotreated in series with 100 μm gabazine and 100 μm picrotoxin (right) and 100 μm gabazine and 0.1% DMSO (left). Treatment intervals are indicated by gray shaded regions. H, Summary period data as mean ± SEM for series cotreatment experiment. Treatments are as indicated, and in-series treatments are grouped by brackets. I, Example PMT traces for continuous wild-type SCN explant experiments cotreated with 100 μm gabazine and 100 μm picrotoxin (right) and 100 μm gabazine and 0.1% DMSO (left). Treatment intervals are indicated by gray shaded regions. J, Summary period data as mean ± SEM for cotreated experiments. Treatments are as indicated. K, Fibroblast representative traces (detrended) for 500 μm picrotoxin treatment (right) and 0.5% DMSO treatment (left). L, Summary period data for fibroblast experiments as indicated. n values are detailed throughout the text. *p < 0.05, **p < 0.01, ***p < 0.001, ****p < 0.0001.
Figure 2.
Figure 2.
Representative single peaks demonstrate alterations in waveform profile caused by genetic manipulation of explant SCN period. A–C, Top panels show composite single normalized cycles (solid black) peak aligned and overlaid with wild-type PER2::LUC traces (WT; dashed gray). The top x-axis displays time in hours for the wild-type PER2::LUC trace, and the bottom x-axis displays time in hours for the PER2::LUC trace of the aligned condition. Central panels display peak-aligned traces as in the top panel on a normalized time base (normalized period). Bottom panels display mean waveform profiles as first derivative of normalized bioluminescence (FD PER2::LUC) versus the normalized period as wild-type profile (solid gray) overlaid with period mutants (solid black). A, CK1εTau/Tau × PER2::LUC (CT). B, Fbxl3Afh/Afh × PER2::LUC (FA). C, Wild-type PER2::LUC slices (WT) treated with vehicle, as follows: baseline (dashed black; top only), 0.1% DMSO (solid light gray), 0.01% H2O (solid black), and 0.5% DMSO (solid dark gray). D–L, Left, Mean first derivative plot of vehicle-treated (solid gray) or period-altering-compound-treated (solid black) normalized PER2::LUC bioluminescence (FD PER2::LUC). Right, Constellation plots showing mean shifts in peaks of PER2 accumulation (black) and dissipation (gray). Hollow symbols indicate vehicle treated values, and solid symbols indicate drug-treated values. Values are shown as mean ±SEM in both x (temporal ratio) and y (amplitude ratio) directions, and significance is indicated by square brackets for either accumulation (black) or dissipation (gray). Treatments are shown on different genetic backgrounds: wild-type PER2::LUC (D–F), 100 μm picrotoxin/0.1% DMSO (D), 1 μm PF-670462/0.01% H2O (E), 100 μm KNK/0.5% DMSO (F); CK1εTau/Tau × PER2::LUC (G–I), 100 μm picrotoxin/0.1% DMSO (G), 1 μm PF-670462/0.01% H2O (H), 100 μm KNK/0.5% DMSO (I); Fbxl3Afh/Afh × PER2::LUC (J–L), 100 μm picrotoxin/0.1% DMSO (J), 1 μm PF-670462/0.01% H2O (K), 100 μm KNK/0.5% DMSO (L). First derivative plots and alignments on a normalized time base are shown as mean ± SEM as error banding. For normalized period-aligned plots, gray shading indicates the level of significant difference as assessed by two-way ANOVA, graded by lightest (p < 0.05) to darkest (p < 0.0001), as indicated in the key above A. n values are detailed throughout the text. *p < 0.05, **p < 0.01, ***p < 0.001, ****p < 0.0001.
Figure 3.
Figure 3.
Baseline subtraction (FDA-S) reveals phase-specific pharmacological patterning. A–I, Baseline-subtracted treatment cycles (FD Difference) versus normalized period ordered by genotype and treatment. Vehicle (solid gray) and treatment (solid black) are coplotted as mean ± SEM as shaded error banding. The significant differences between vehicle and treatment determined by two-way ANOVA are indicated by graded gray shading as detailed in the key above A. Treatments are as follows: wild-type PER2::LUC (WT; A–C), 100 μm picrotoxin/0.1% DMSO (A), 1 μm PF-670462/0.01% H2O (B), and 100 μm KNK/0.5% DMSO (C); CK1εTau/Tau × PER2::LUC (CT; D–F), 100 μm picrotoxin/0.1% DMSO (D), 1 μm PF-670462/0.01% H2O (E), and 100 μm KNK/0.5% DMSO (F); Fbxl3Afh/Afh × PER2::LUC (FA; G–I), 100 μm picrotoxin/0.1% DMSO (G), 1 μm PF-670462/0.01% H2O (H), 100 μm KNK/0.5% DMSO (I). J–L, Phase-specific patterning across the cycle showing the temporal alignment of CK1εTau/Tau × PER2::LUC (light gray), wild-type PER2::LUC (black), and Fbxl3Afh/Afh × PER2::LUC (dark gray) treated with period-altering compounds. Bars show mean peak position ± SD. Solid-capped bars show phase intervals that are significantly different from vehicle in A–I. Dotted uncapped bars show phase intervals that have been identified only via automated peak identification. Treatment and vehicle identities are as follows: 100 μm picrotoxin/0.1% DMSO (J), 1 μm PF-670462/0.01% H2O (K), and 100 μm KNK437/0.5% DMSO (L). M–O, Peak amplitudes of peak phase patterning intervals (Peak FD Difference) illustrated in J–L. Bars are mean ± SEM and indicate the difference between vehicle and treatment for particular genotypes: CK1εTau/Tau × PER2::LUC (light gray), wild-type PER2::LUC (black), and Fbxl3Afh/Afh × PER2::LUC (dark gray). Significant differences are noted by square brackets. Treatment and vehicle identities are as follows: 100 μm picrotoxin/0.1% DMSO (M), 1 μm PF-670462/0.01% H2O (N), and 100 μm KNK437/0.5% DMSO (O). n values are detailed throughout the text. *p < 0.05, **p < 0.01, ***p < 0.001, ****p < 0.0001.
Figure 4.
Figure 4.
First derivative plots reveal differential sensitivity of genotypes to pharmacological manipulation. A. Dose–response curve of CK1εTau/Tau × PER2::LUC genotype titrated with increasing concentrations of the CK1ε inhibitor PF-4800567 (solid black circles) and DMSO (hollow circles). The critical dose to return CK1εTau/Tau × PER2::LUC to the wild-type period is indicated by the dotted line. NR indicates that at 10 μM, slices become nonrhythmic. B, Summary period data for baseline (light gray), 0.5 μm PF-4800567 (black), and washout (dark gray) in CK1εTau/Tau × PER2::LUC slices and wild-type PER2::LUC slices. Genotype is indicated below the bars. Values are shown as mean ± SEM. C–G, First derivative of normalized bioluminescence (FD PER2::LUC) versus the normalized period showing CK1εTau/Tau × PER2::LUC treated with 0.5 μm PF-4800567 (CT: 0.5 μm PF480; C, black) overlaid with CK1εTau/Tau baseline (CT: Baseline; gray), wild-type PER2::LUC baseline (WT: Baseline; D, black) overlaid with CK1εTau/Tau × PER2::LUC baseline (CT: Baseline; gray), CK1εTau/Tau × PER2::LUC treated with 0.5 μm PF-4800567 (CT: 0.5 μm PF480; E, black) overlaid with wild-type PER2::LUC baseline (WT: Baseline; gray), wild-type PER2::LUC treated with 0.5 μm PF-4800567 (WT: 0.5 μm PF480; F, black) overlaid with wild-type baseline (WT: Baseline; gray), and CK1εTau/Tau × PER2::LUC treated with 0.5 μm PF-4800567 (CT: PF480; G, black) overlaid with wild-type PER2::LUC treated with 0.5 μm PF-4800567 (WT: PF480; gray). Values are mean ± SEM, indicated by shaded error banding. H–J, Baseline subtraction showing (FD Difference) CK1εTau/Tau × PER2::LUC treated with either 0.5 μm PF-4800567 (black) or 0.1% DMSO (gray; H), wild-type PER2::LUC treated with either 0.5 μm PF-4800567 (black) or 0.1% DMSO (gray; I), and CK1εTau/Tau × PER2::LUC treated with 0.5 μm PF-4800567 (black) overlaid with wild-type PER2::LUC treated with 0.5 μm PF-4800567 (gray; J). Values are mean ± SEM, indicated as shaded error banding. K, Phase-specific patterning across the cycle showing the temporal alignment of CK1εTau/Tau × PER2::LUC (CT; black) and wild-type PER2::LUC (WT; gray) peaks from slices treated with 0.5 μm PF-4800567. Bars show mean peak position ± SD. Solid capped bars show phase intervals that are significantly different from vehicle in H and I. Dotted uncapped bars show phase intervals that have been identified only via automated peak identification. L, Peak amplitudes of peak phase patterning intervals highlighted in K. Bars are mean ± SEM and indicate the absolute amplitude for either CK1εTau/Tau × PER2::LUC (black) or wild-type PER2::LUC (gray). Significant differences are noted by square brackets. Significant differences for first derivative plots (C–G) and baseline subtractions (G–J) are indicated by graded gray shading as described in the key in C. n values are detailed throughout the text. *p < 0.05, **p < 0.01, ***p < 0.001, ****p < 0.0001.
Figure 5.
Figure 5.
Network and cell-autonomous properties of the SCN are unaffected by pushing period to short or long extremes. A–F, SARFIA single-cell imaging analysis of CK1εTau/Tau × PER2::LUC treated with 100 μm picrotoxin (A–C) and Fbxl3Afh/Afh × PER2::LUC treated with 100 μm KNK437 (D–F). A, Summary period data from individual oscillators shown as mean ± SEM for baseline (black), 100 μm picrotoxin (+100 μm picrotoxin; red), and 100 μm picrotoxin/1 μm TTX cotreatment (+1 μm TTX; gray). B, Individual oscillators were assessed by SARFIA identification and analysis of ROIs, indicated as color-coded regions on the inset bioluminescent SCN image (left). Raster plots of 100 individual representative oscillators within the SCN are shown for baseline (top), 100 μm picrotoxin (middle), and 100 μm picrotoxin/1 μm TTX cotreatment (bottom). Relative bioluminescence intensity is color coded according to the color bar. Rayleigh plots are shown next to their corresponding raster plot. Phases of individual oscillators are plotted as circles, and the degree of synchrony is indicated by the length of the vector in the center. C, Summary synchrony data reported as mean vector length from individual Rayleigh analyses. Values are shown as mean ± SEM for baseline (black), 100 μm picrotoxin (red), and 100 μm picrotoxin/1 μm TTX cotreatment (gray). D, Summary period data from individual oscillators shown as mean ± SEM for baseline (black), 100 μm KNK437 (+100 μm KNK437; red), and 100 μm KNK437/1 μm TTX cotreatment (+1 μm TTX; gray). E, Individual oscillators were assessed by SARFIA identification and analysis of ROIs, indicated as color-coded regions on the inset bioluminescent SCN image (left). Raster plots of 100 individual representative oscillators within the SCN are shown for baseline (top), 100 μm picrotoxin (middle), and 100 μm KNK437/1 μm TTX cotreatment (bottom). Relative bioluminescence intensity is color coded according to the color bar. Rayleigh plots shown next to their corresponding raster plot. Phases of individual oscillators are plotted as circles, and the degree of synchrony is indicated by the length of the vector in the center. F, Summary synchrony data reported by mean vector length from individual Rayleigh analyses. Values are shown as mean ± SEM for baseline (black), 100 μm KNK437 (red), and 100 μm KNK437/1 μm TTX cotreatment (gray). G, Relative period range width from individual oscillators identified by SARFIA analysis in A and D expressed as a percentage of the overall cellular period. Values are shown as mean ± SEM for baseline (black), treatment (red), and TTX cotreatment (gray). Period-altering treatment conditions are detailed below the bars (+100 μm picrotoxin or +100 μm KNK437), and genotypes are detailed above the bars (CK1εTau/Tau × PER2::LUC or Fbxl3Afh/Afh × PER2::LUC). n values are detailed throughout the text. *p < 0.05, **p < 0.01, ***p < 0.001, ****p < 0.0001.
Figure 6.
Figure 6.
Network waveform properties of the SCN are unaffected by pushing period to short or long extremes. A–D, CoL analysis of CK1εTau/Tau × PER2::LUC treated with 100 μm picrotoxin (A, B) and Fbxl3Afh/Afh × PER2::LUC treated with 100 μm KNK437 (C, D). A, Left, Representative path vectors of center of luminescence across the slice displaying individual paths for three cycles before (dashed lines, graded gray) and during 100 μm picrotoxin application (solid lines, graded gray) and corresponding mean paths (right) showing baseline (gray) overlaid with 100 μm picrotoxin (black). Right, Representative single images of one SCN overlaid with mean path vectors (black) for baseline (left) and 100 μm picrotoxin (right). B, Summary data showing mean path index for baseline (gray) and 100 μm picrotoxin (black). Individual values are shown as hollow circles linked by dashed lines. C, Left, Representative path vectors of center of luminescence across the slice displaying individual paths for three cycles before (dashed lines, graded gray) and during 100 μm KNK437 application (solid lines, graded gray) and corresponding mean paths (right) showing baseline (gray) overlaid with 100 μm KNK437 (black). Right, Representative single images of one nucleus overlaid with mean path vectors (black) for baseline (left) and 100 μm KNK437 (right). D, Summary data showing mean path index for baseline (gray) and 100 μm KNK437 (black). Individual values are shown as hollow circles linked by dashed lines. Bars indicate mean ± SEM. n values are as detailed in text.

References

    1. Atkinson SE, Maywood ES, Chesham JE, Wozny C, Colwell CS, Hastings MH, Williams SR. Cyclic AMP signaling control of action potential firing rate and molecular circadian pacemaking in the suprachiasmatic nucleus. J Biol Rhythms. 2011;26:210–220. doi: 10.1177/0748730411402810. - DOI - PubMed
    1. Bordyugov G, Abraham U, Granada A, Rose P, Imkeller K, Kramer A, Herzel H. Tuning the phase of circadian entrainment. J R Soc Interface. 2015;12:20150282. doi: 10.1098/rsif.2015.0282. - DOI - PMC - PubMed
    1. Brancaccio M, Maywood ES, Chesham JE, Loudon AS, Hastings MH. A Gq-Ca2+ axis controls circuit-level encoding of circadian time in the suprachiasmatic nucleus. Neuron. 2013;78:714–728. doi: 10.1016/j.neuron.2013.03.011. - DOI - PMC - PubMed
    1. Brancaccio M, Enoki R, Mazuski CN, Jones J, Evans JA, Azzi A. Network-mediated encoding of circadian time: the suprachiasmatic nucleus (SCN) from genes to neurons to circuits, and back. J Neurosci. 2014;34:15192–15199. doi: 10.1523/JNEUROSCI.3233-14.2014. - DOI - PMC - PubMed
    1. Buhr ED, Yoo SH, Takahashi JS. Temperature as a universal resetting cue for mammalian circadian oscillators. Science. 2010;330:379–385. doi: 10.1126/science.1195262. - DOI - PMC - PubMed

MeSH terms

LinkOut - more resources