. 2016 Sep 7;36(36):9342-50.
doi: 10.1523/JNEUROSCI.1678-15.2016.

Reactivation of Rate Remapping in CA3

Affiliations

Reactivation of Rate Remapping in CA3

C Daniela Schwindel et al. J Neurosci. .

Abstract

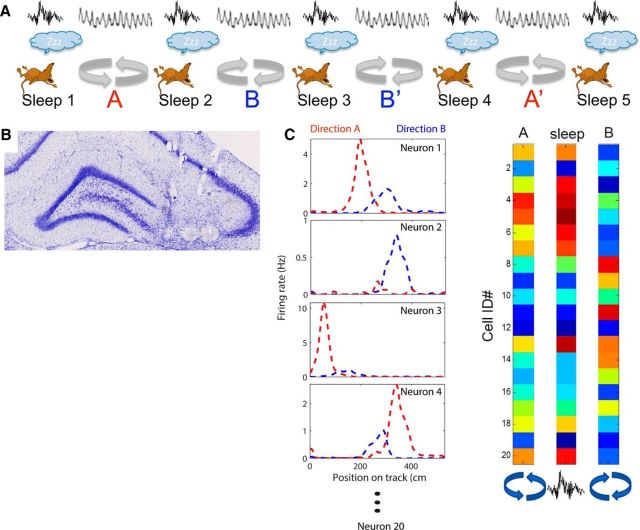
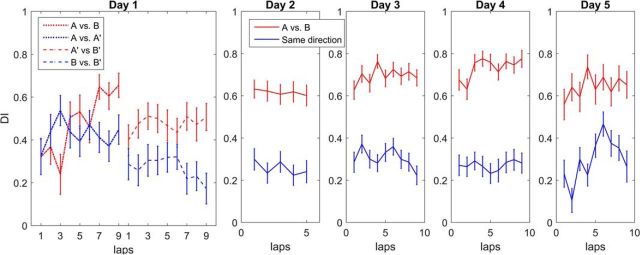
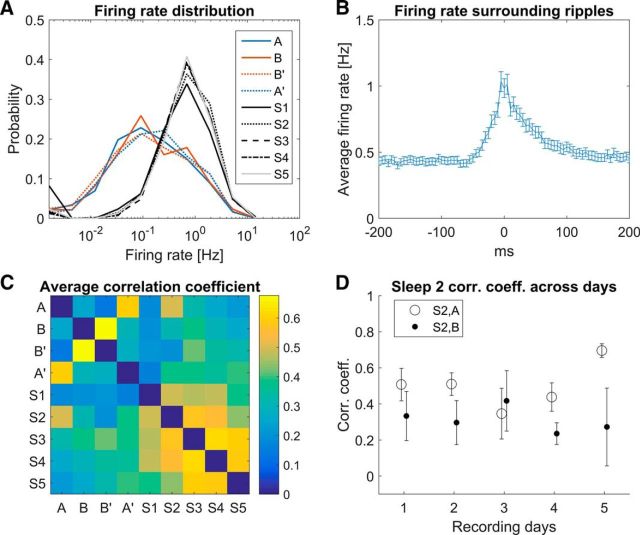
The hippocampus is thought to contribute to episodic memory by creating, storing, and reactivating patterns that are unique to each experience, including different experiences that happen at the same location. Hippocampus can combine spatial and contextual/episodic information using a dual coding scheme known as "global" and "rate" remapping. Global remapping selects which set of neurons can activate at a given location. Rate remapping readjusts the firing rates of this set depending on current experience, thus expressing experience-unique patterns at each location. But can the experience-unique component be retrieved spontaneously? Whereas reactivation of recent, spatially selective patterns in hippocampus is well established, it is never perfect, raising the issue of whether the experiential component might be absent. This question is key to the hypothesis that hippocampus can assist memory consolidation by reactivating and broadcasting experience-specific "index codes" to neocortex. In CA3, global remapping exhibits attractor-like dynamics, whereas rate remapping apparently does not, leading to the hypothesis that only the former can be retrieved associatively and casting doubt on the general consolidation hypothesis. Therefore, we studied whether the rate component is reactivated spontaneously during sleep. We conducted neural ensemble recordings from CA3 while rats ran on a circular track in different directions (in different sessions) and while they slept. It was shown previously that the two directions of running result in strong rate remapping. During sleep, the most recent rate distribution was reactivated preferentially. Therefore, CA3 can retrieve patterns spontaneously that are unique to both the location and the content of recent experience.

Significance statement: The hippocampus is required for memory of events and their spatial contexts. The primary correlate of hippocampal activity is location in space, but multiple memories can occur in the same location. To be useful for distinguishing these memories, the hippocampus must be able, not only to express, but also to retrieve both spatial and nonspatial information about events. Whether it can retrieve nonspatial information has been challenged recently. We exposed rats to two different experiences (running in different directions) in the same locations and showed that even the nonspatial components of hippocampal cell firing are reactivated spontaneously during sleep, supporting the conclusion that both types of information about a recent experience can be retrieved.

Keywords: CA3; episodic memory; hippocampus; memory reactivation; rate remapping.


Figures

Figure 1.
Figure 1.
Experimental methods. A, Behavioral sequence of the experiment. Animals rested before and after each of four running sessions. In the first and last running sessions, the animals ran in one direction in a circular track to receive a food reward at one location (sessions A and A′). In the other two running sessions, the rats ran along the same track, but in the opposite direction to receive a reward at the same location (sessions B and B′). During the rest periods, sharp-wave ripple complexes were recorded in CA1 and CA3. B, Representative histological section. A coronal slice through the dorsal hippocampus of rat 9 shows 3 lesions in CA3, which were made at the electrode tips after all recording sessions were completed. Tracks of additional tetrodes are also visible above the CA3. C, Analysis procedure. The average firing rates of each cell during each running and rest session were calculated and compared. The critical comparison is between running session A and the sleep immediately following (Sleep 2) and the same sleep with running session B, which had not yet been experienced that day.
Figure 2.
Figure 2.
Asymmetry of place fields and its effect on the analysis. A, Place fields show an offset between running directions, depending on the reference position of the animal. The left panels show an example place field that has a field in both directions (session A and B), but shows a slight offset. The normalized firing rate against position on the track (top) and the theta phase of each spike plotted against position on the track are displayed. Direction A and B are marked blue and red and the arrows above the phase plots indicate the running direction. The right panels illustrate the effect of the reference position of the animal on the position of the spikes in various theta phases (modified from Skaggs et al., 1996). When the back of the head is taken as reference (as is the case in our recordings), only the spikes in the late theta phase will overlap (bottom). B, Illustration of the manipulation of place fields for spatial correlation analyses. The positions of a field in direction A and B on the circular track are displayed first. Firing rate is false color coded, with warmer colors indicating higher rates. The right-most schematic illustrates that, when simply overlaying the sessions in different running directions, the field does not line up due to both the field offset shown in part A and field asymmetry. Therefore, the field in direction B is first flipped and then rotated by an amount calculated for each dataset (bottom left) to maximize the overlap of the place field in the two directions (bottom right). C, Hypothetical asymmetric place fields of two neurons (blue and green) are drawn on the track (x-axis). The fields show expansion opposite to the animal's running direction (black arrows). The two cells show different place field locations, but each shows the same peak firing location and rate (y-axis) in the two directions. The Euclidean distance (double sided arrow) between their peak firing locations (dashed line) is constant in the two directions. The area in which the firing of the two place cells overlaps is indicated in red and differs in the two directions. This difference will affect the correlation coefficient between the neuron pair in the two directions and bias the result toward finding a difference between the two directions and rejecting the null hypothesis when it is true (the individual neurons do not show rate remapping). Therefore, we only used net firing rate (over the whole track) for correlation analyses, which avoids this issue.
Figure 3.
Figure 3.
Rate remapping in different running directions on circular track. Six examples taken from 2 different rats on 3 different days illustrate the rate differences within place fields in different directions (indicated by colors blue and red). For each neuron, the normalized (i.e., occupancy corrected) firing rate is plotted in the two directions (blue and red dashed lines in first row) against the linearized position in centimeters on the track. The reward location is at 0 cm. The theta phases of the spikes discharged in the two directions are plotted below. Two full cycles of theta phase are plotted for illustration purposes. Arrows over theta phase plots indicate running direction. Theta phase plots are not occupancy corrected, which is why there is an accumulation of spikes around the reward zone at the beginning of the track.
Figure 4.
Figure 4.
Similarity between spatial maps. A, The population vector correlations of the binned spatial maps (bin size: 5 cm) of all neurons of the pooled data of all rats in session A and A′ (repeated recording in the same running direction; A) and B and B′ (B) are plotted. Population vector correlations of corresponding position on the track (plotted along diagonal) show the highest values, whereas the values decrease with increasing offset between population vector locations. C, Population vector correlation matrix for sessions in opposite directions after normalizing each row to their maximum, flipping spatial bins within field boundaries and alignment of fields, shows lower values along the diagonal as well as a broader band. This effect arises from differences in firing rates as caused by rate remapping, asymmetric field expansion, and phase precession effects, which result in place fields in opposite directions being offset slightly when the rat's head is taken as the position reference (Fig. 14E in Skaggs et al., 1996). However, the spatial structure of field location in the two directions is preserved. D, Contrast with the rate remapping simulation, in which the spatial bins of all cells are randomly rotated around the track for one running direction. In this case, there is no correlation along the diagonal. N = 356 cells with a maximal firing rate (in position bins) >0.05 Hz in any one running session. Top color bar applies to A and B and bottom color bar applies to C and D.
Figure 5.
Figure 5.
Rate remapping is measured with the DI. The DI, defined as the difference in the number of spikes fired per lap in the two directions divided by the sum of the number of spikes of a neuron, is plotted for each recording day and pooled over animals. The mean and SEM of the DI in the different direction comparison (red, A vs B and A′ vs B′) and same direction comparison (blue, A vs A′ and B vs B′) over all animals for each lap are plotted (Wilcoxon rank-sum test, one-tailed, day 1, p = 0.004, days 2–5, p < 0.0001). For day 1, the DIs in the first two sessions (A vs B) were not significantly different from the A versus A′ comparison, but the DI increased over laps, as shown previously (Navratilova et al., 2012). By sessions 3 and 4 (A′ vs B′), the DIs were significantly different from the same direction comparison. On Days 2–5, the DIs in the first 2 sessions did not differ from the DIs in the last 2 sessions and thus were plotted together for clarity. Laps are cut off at the worst-performing animal on that day.
Figure 6.
Figure 6.
Lognormal firing rate distribution, CA3 unit activity with respect to ripple peak times and the reactivation of rate remapping. A, Firing rate distribution of all recorded single units is plotted for all behavioral (red and blue solid and dashed lines) and all sleep sessions during ripples (black and gray solid, dashed and dotted dashed lines). Note the log scale on the rate axis: the firing rate distribution of CA3 neurons is lognormal in each session. B, CA3 cell activity cross-correlation with ripple peak times in the EEG with a bin size of 5 ms. The mean and SEM are plotted for each bin. CA3 neurons show elevated firing within a window of −30 ms to +70 ms around the peak of ripple oscillations recorded in the CA1 pyramidal layer. C, Mean firing rates of all cells in all running and rest sessions were log transformed. Then the population vector for each rat and each day was correlated between all sessions. The correlation matrix represents the average correlation over all recording sessions (n = 22). Correlations of each session with itself are by definition 1 (along the unity line), but these values are removed for a clearer comparison between sessions. Note that behavior sessions A vs A′ and B vs B′ show the highest correlations, as do correlations between subsequent sleep sessions. Among the running versus sleep session correlations (upper right and lower left quadrants), sleep 2 versus A stands out as the most correlated. D, Correlation between S2 and A (open circles), as well as between S2 and B (closed circles), are plotted over the 5 recording days. Error bars represent the SEM calculated across rats (day 1–4: n = 5; day 5: n = 2). The correlations between S2 and A are significantly higher than between S2 and B (paired t test, one tailed, n = 22 recording sessions, p = 0.028).

Similar articles

Cited by

References

    1. Allen K, Rawlins JN, Bannerman DM, Csicsvari J. Hippocampal place cells can encode multiple trial-dependent features through rate remapping. J Neurosci. 2012;32:14752–14766. doi: 10.1523/JNEUROSCI.6175-11.2012. - DOI - PMC - PubMed
    1. Amit DJ, Treves A. Associative memory neural network with low temporal spiking rates. Proc Natl Acad Sci U S A. 1989;86:7871–7875. doi: 10.1073/pnas.86.20.7871. - DOI - PMC - PubMed
    1. Anderson MI, Jeffery KJ. Heterogeneous modulation of place cell firing by changes in context. J Neurosci. 2003;23:8827–8835. - PMC - PubMed
    1. Battaglia FP, Sutherland GR, Cowen SL, Mc Naughton BL, Harris KD. Firing rate modulation: a simple statistical view of memory trace reactivation. Neural Netw. 2005;18:1280–1291. doi: 10.1016/j.neunet.2005.08.011. - DOI - PubMed
    1. Bower MR, Euston DR, McNaughton BL. Sequential-context-dependent hippocampal activity is not necessary to learn sequences with repeated elements. J Neurosci. 2005;25:1313–1323. doi: 10.1523/JNEUROSCI.2901-04.2005. - DOI - PMC - PubMed

Publication types