. 2016 Sep 7;36(36):9351-64.
doi: 10.1523/JNEUROSCI.0843-16.2016.

Prefrontal Neurons Represent Motion Signals from Across the Visual Field But for Memory-Guided Comparisons Depend on Neurons Providing These Signals

Affiliations

Prefrontal Neurons Represent Motion Signals from Across the Visual Field But for Memory-Guided Comparisons Depend on Neurons Providing These Signals

Klaus Wimmer et al. J Neurosci. .

Abstract

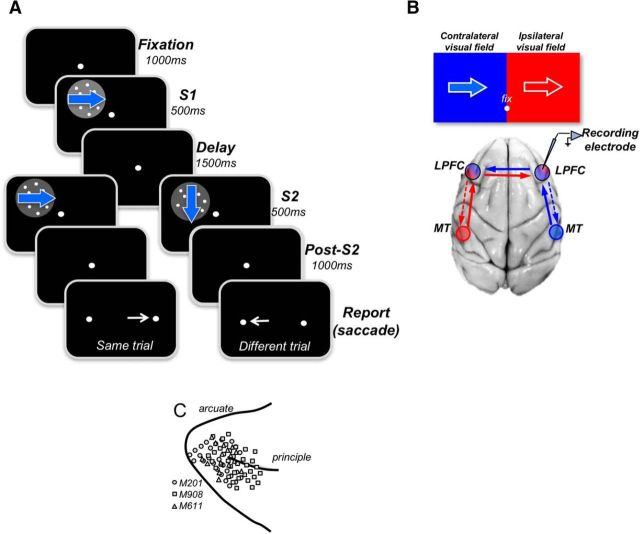
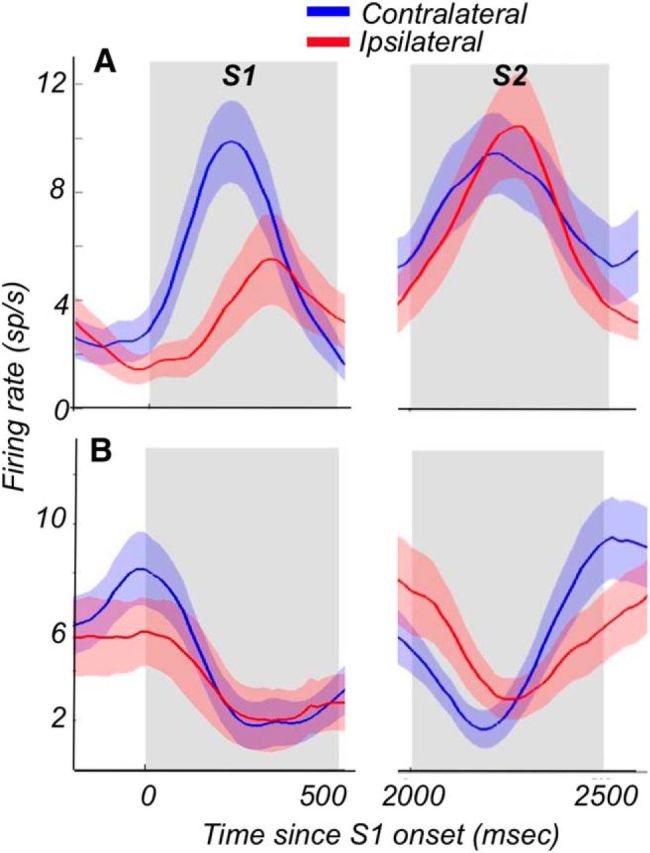
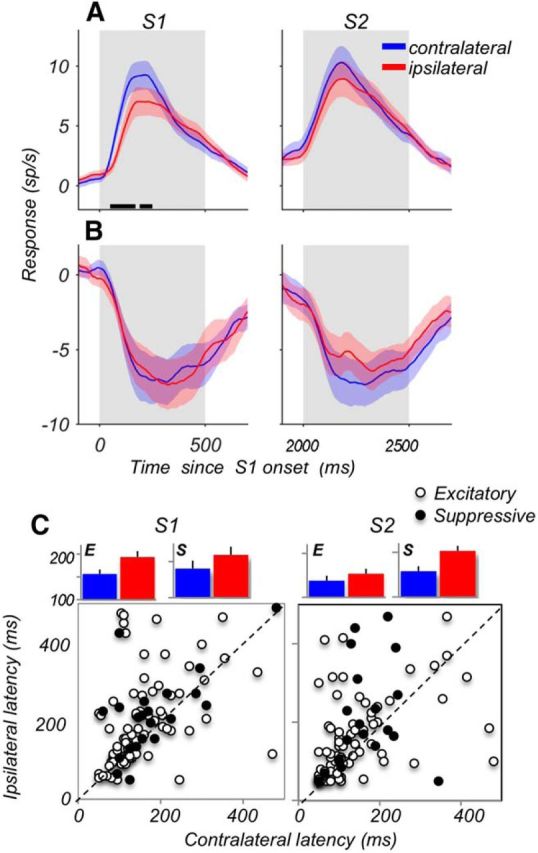
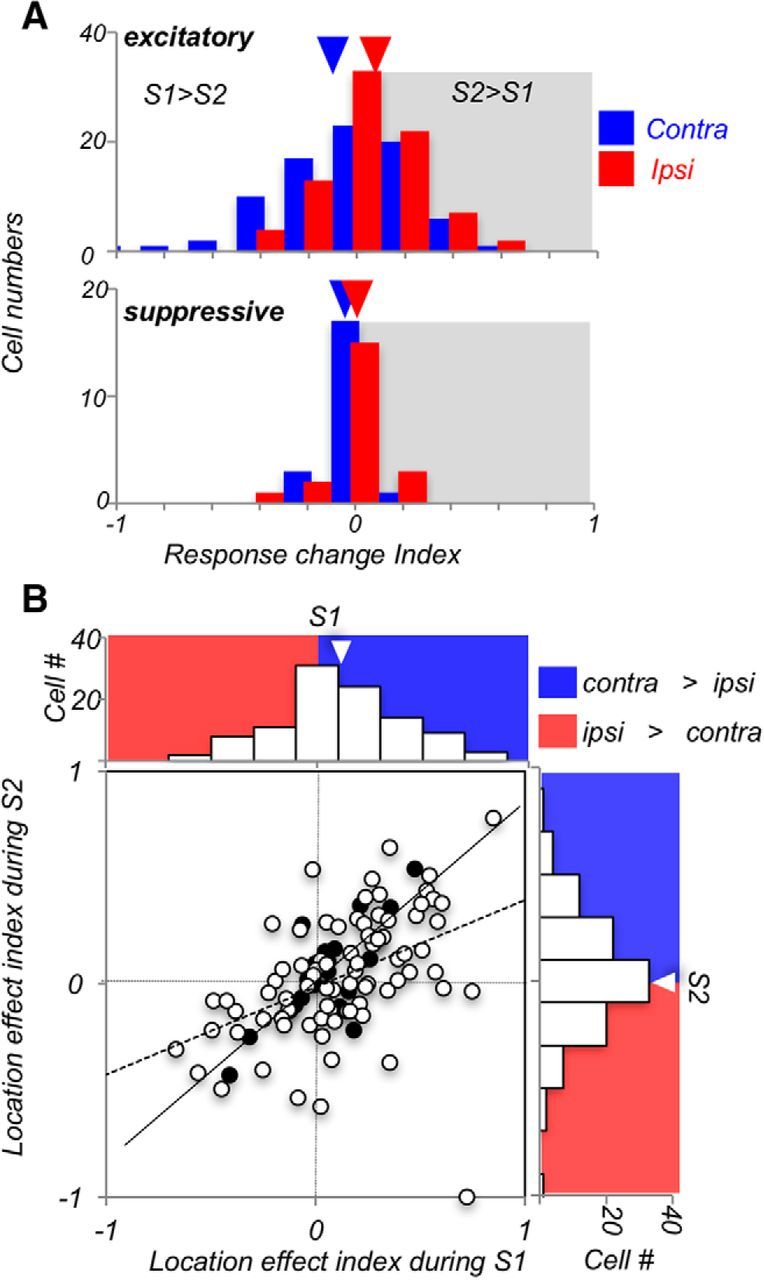
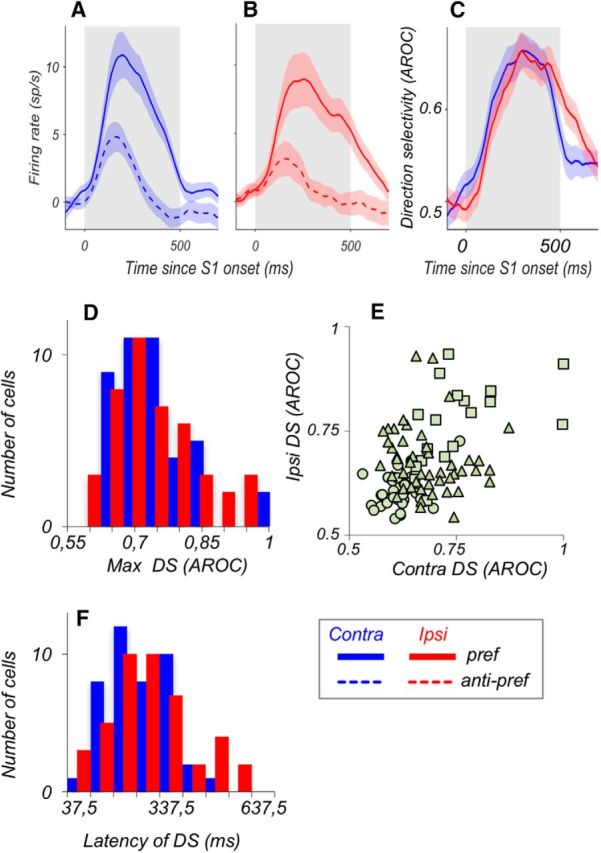
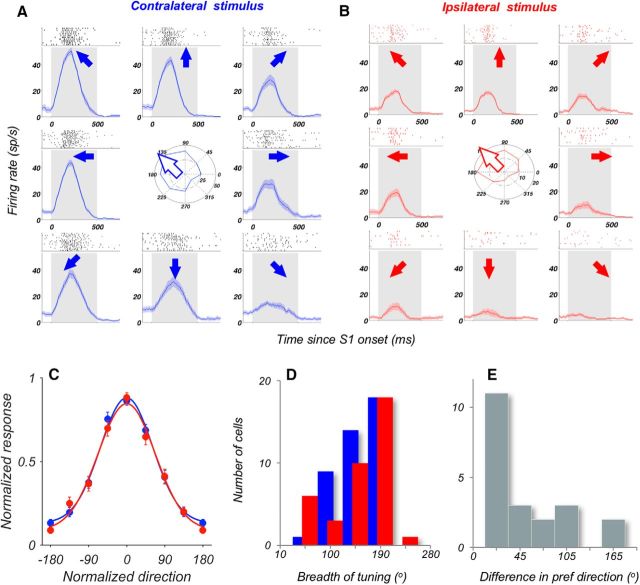
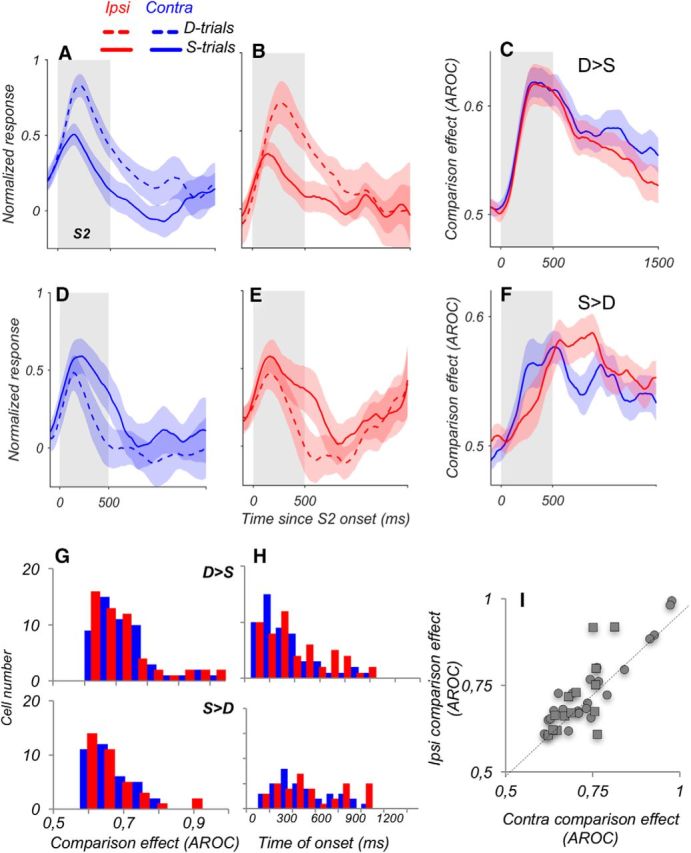
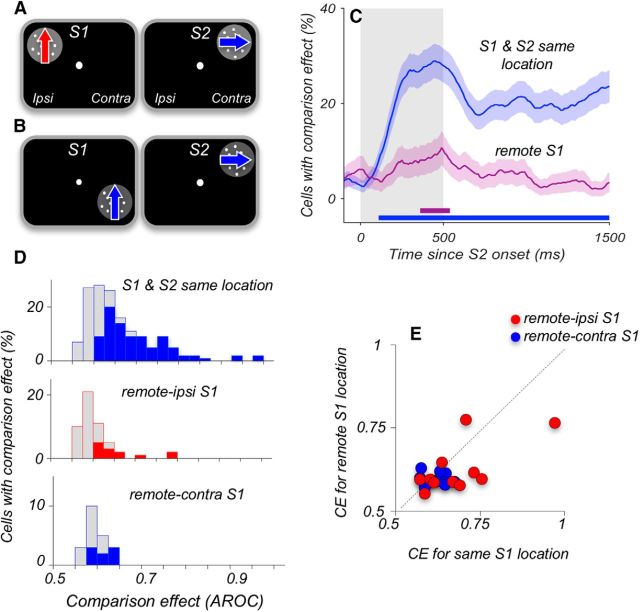
Visual decisions often involve comparisons of sequential stimuli that can appear at any location in the visual field. The lateral prefrontal cortex (LPFC) in nonhuman primates, shown to play an important role in such comparisons, receives information about contralateral stimuli directly from sensory neurons in the same hemisphere, and about ipsilateral stimuli indirectly from neurons in the opposite hemisphere. This asymmetry of sensory inputs into the LPFC poses the question of whether and how its neurons incorporate sensory information arriving from the two hemispheres during memory-guided comparisons of visual motion. We found that, although responses of individual LPFC neurons to contralateral stimuli were stronger and emerged 40 ms earlier, they carried remarkably similar signals about motion direction in the two hemifields, with comparable direction selectivity and similar direction preferences. This similarity was also apparent around the time of the comparison between the current and remembered stimulus because both ipsilateral and contralateral responses showed similar signals reflecting the remembered direction. However, despite availability in the LPFC of motion information from across the visual field, these "comparison effects" required for the comparison stimuli to appear at the same retinal location. This strict dependence on spatial overlap of the comparison stimuli suggests participation of neurons with localized receptive fields in the comparison process. These results suggest that while LPFC incorporates many key aspects of the information arriving from sensory neurons residing in opposite hemispheres, it continues relying on the interactions with these neurons at the time of generating signals leading to successful perceptual decisions.

Significance statement: Visual decisions often involve comparisons of sequential visual motion that can appear at any location in the visual field. We show that during such comparisons, the lateral prefrontal cortex (LPFC) contains accurate representation of visual motion from across the visual field, supplied by motion processing neurons. However, at the time of comparison, LPFC neurons can only use this information to compute the differences between the stimuli, if stimuli appear at the same retinal location, implicating neurons with localized receptive fields in the comparison process. These findings show that sensory comparisons rely on the interactions between LPFC and sensory neurons that not only supply sensory signals but also actively participate in the comparison of these signals at the time of the decision.

Keywords: direction selectivity; hemifields; working memory.


Figures

Figure 1.
Figure 1.
Behavioral tasks and recording sites. A, Behavioral tasks. On each trial, the monkeys viewed two directions of motion separated by a delay, S1 and S2, and were rewarded for reporting whether they were the same or different by making a saccade to one of two targets (right target: same; left target: different). During S1, stimuli moved in 1 of 8 equally spaced directions and were followed by S2 stimuli moving in the same or in different directions. The animals were allowed to respond 1000 ms after the termination of the second stimulus (S2). B, Diagram of MT-LPFC connectivity and visual field representation in both regions. Each visual field is labeled as contralateral (blue) and ipsilateral (red) with respect to the recording electrode shown over the LPFC of the right hemisphere. The drawing shows MT providing direct input to the LPFC in the same hemisphere. Each MT is drawn as red and blue circles to indicate their representation of the opposite visual field. Solid arrows indicate bottom-up inputs from MT. Dashed arrows indicate top-down inputs from the LPFC. C, Locations of electrode penetrations for all LPFC recordings of the three monkeys (indicated by different symbols). Recording chambers were placed over the right LPFC in Monkeys 201 and 908. Monkey M611 had recording chambers on both sides, and the recording locations were transferred to the same side.
Figure 2.
Figure 2.
Activity of two example neurons on trials with contralateral and ipsilateral stimuli. Average activity for an example neuron with excitatory responses (A) and suppressive responses (B). Activity of each example neurons was recorded during separate blocks of trials with both S1 and S2 presented either in the contralateral (blue) or in the ipsilateral (red) hemifield. Only trials with responses to the preferred direction for S1 and S2 are shown.
Figure 3.
Figure 3.
Responses to contralateral stimuli emerge earlier and are stronger. A, Responses of excitatory cells (N = 81) during S1 and S2, for contralateral (blue) and ipsilateral (red) stimuli. The baseline activity (in a 300 ms window before the onset of S1) was subtracted for each neuron. Black horizontal lines along the x-axis indicate periods with significantly different responses to contralateral and ipsilateral stimuli (p < 0.05; permutation test). B, Same as A, but for suppressive neurons (N = 21). Because of the subtracted baseline, suppressive neurons show negative responses. C, Comparison of latencies of contralateral and ipsilateral responses on a cell-by-cell basis. Open circles represent excitatory cells (N = 81). Filled circles represent suppressive cells (N = 21). Bar plots represent the average latencies ± SEM for excitatory (E) and suppressive (S) neurons. Contralateral responses of the excitatory neurons were 41 ms shorter during S1 (p = 0.0004; Wilcoxon test) and 17 ms shorter during S2 (p = 0.031). Latencies of suppressive neurons showed the same trend, although differences between contralateral and ipsilateral responses were not statistically significant (S1: 37 ms shorter, p = 0.11; S2: 45 ms shorter p = 0.11, Wilcoxon tests).
Figure 4.
Figure 4.
Ipsilateral responses are enhanced during S2. A, Comparison of responses during S1 and S2. RCI = (S2 − S1)/(S2 + S1), comparing firing rates of responses to S1 and S2 recorded on the same trial, for contralateral and ipsilateral stimuli. Neurons with excitatory responses (top) show, on average, only little change for contralateral stimuli, and a predominantly positive RCI for ipsilateral stimuli, indicating stronger S2 responses in this condition (p = 0.018, Wilcoxon test). Responses of suppressive neurons (bottom) show only little differences between S1 and S2, and their RCI for contralateral and ipsilateral stimuli is not different (p = 0.38, Wilcoxon test). B, LEI = (contra − ipsi)/(contra + ipsi), comparing the strength of contralateral and ipsilateral responses during S1 and S2 for each neuron. The dominance of contralateral responses weakens during S2. Open circles represent excitatory cells (N = 81). Filled circles represent suppressive cells (N = 21). Regression lines (least-square fit to the data points) are shown for excitatory cells (solid lines) and suppressive cells (dashed lines).
Figure 5.
Figure 5.
Contralateral and ipsilateral responses carry comparable DS signals. A, B, Average responses recorded during S1 for preferred stimuli (solid) and antipreferred stimuli (dashed) for neurons that were DS for contralateral stimuli (A; N = 42 of 102 neurons) and for ipsilateral stimuli (B; N = 43 of 102 neurons). The baseline activity (in a 300 ms window before the onset of S1) was subtracted for each neuron, and the absolute value of the resulting firing rate was taken for suppressive neurons. C, Average direction selectivity of the neurons from A, B, quantified with ROC analysis (see Methods and Materials). D, Distributions of maximal direction selectivity computed for ipsilateral and contralateral responses. The data for excitatory and suppressive responses were combined. There was no significant difference in selectivity for stimuli in the two locations (p = 0.88, Wilcoxon test). E, Cell-by-cell comparison of direction selectivity for ipsilateral and contralateral stimuli. Each data point represents neurons with significant direction selectivity in both conditions (□), in only one condition (▵), or with no significant effect (○). The correlation in the strength of DS for the two hemifields was highly significant (Pearson correlation, r = 0.443, p = 3.2 × 10⁻⁶). F, Distribution of latencies of DS for contralateral and ipsilateral stimuli. Latencies were not significantly different (contra: 237 ± 15 ms; ipsi: 267 ± 21 ms; p = 0.44, Wilcoxon test).
Figure 6.
Figure 6.
Similar tuning for motion direction for contralateral and ipsilateral stimuli. A, B, Direction tuning for contralateral stimuli (A) and ipsilateral stimuli (B) of an example neuron. Each plot represents average activity and the rasters in response to stimuli moving in eight equally spaced directions, indicated by arrows. Gray shading represents stimulus period. Polar plots in the center represent the average responses for each direction. An arrow indicates the resulting preferred direction of the cell computed using the vector sum (Materials and Methods). C, Average direction tuning curve for contralateral and ipsilateral stimuli, for neurons well fit by a Gaussian (contra, N = 42 neurons; ipsi, N = 38 neurons; all R2 > 0.5; see Materials and Methods). Individual tuning curves were aligned to 0°. Solid lines are a Gaussian fit to the data points. D, Breadth of tuning for direction for the neurons fit by a Gaussian (same neurons as in C). E, Difference of preferred directions in response to contralateral and ipsilateral stimuli for neurons with Gaussian tuning curves (R2 > 0.5) in both hemifields (N = 21 neurons).
Figure 7.
Figure 7.
Similar CEs for contralateral and ipsilateral stimuli. A, B Average responses of D > S neurons with higher activity for trials in which the S2 moved in a direction different from S1 (D-trials; dashed lines), shown separately for contralateral (A) and ipsilateral (B) stimuli (contra, N = 53; ipsi, N = 54). Responses of individual neurons were normalized by subtracting the baseline activity and by dividing by the peak response during and after S2. C, Average CE computed for responses during S- and D-trials for D > S neurons, shown in A, B. The difference in firing rate between S-trials and D-trials was quantified with ROC analysis. D, E, Average responses of S > D neurons with higher activity for trials in which the S2 moved in the same direction as S1, shown separately for contralateral (D) and ipsilateral (E) stimuli (contra and ipsi, N = 36). F. Average CE for S > D neurons for stimuli in the two hemifields (N = 36), quantified with ROC analysis. G, Distribution of CEs for contralateral and ipsilateral stimuli, shown separately for neurons with D > S effects (top) and neurons with S > D effects (bottom). There was no difference in these effects for stimuli in the two hemifields (D > S, p = 0.18; S > D, p = 0.67). H, Time to the onset of CE for neurons with D > S (top) and S > D effects (bottom) reveals no significant differences between contra and ipsi conditions. I, Relationship of CEs for contralateral versus ipsilateral stimuli, for D > S neurons (●) and S > D neurons (■). For this analysis, we selected neurons with consistent CEs in both hemifields (i.e., D > S or S > D in both cases; N = 39 of 58 neurons with significant CEs in both conditions).
Figure 8.
Figure 8.
Comparison signals weaken when S1 and S2 appear at different locations. A, B, Diagram of stimulus locations in the tasks with separated S1 and S2. S2 always appeared in the upper quadrant of the contralateral hemifield. In the remote-ipsi condition, S1 appeared in the corresponding location of the ipsilateral hemifield (A); and in the remote-contra condition, S1 appeared in the same hemifield as S2 but was displaced by 5° into the lower quadrant (B). In the standard version of our experiment (Fig. 1A), both S1 and S2 appeared at the same location. C, Percentage of neurons with significant CE at each time point, for S1 and S2 at the same location (N = 152 neurons) and for separated S1 and S2 stimuli (N = 73 neurons). The data recorded during the two conditions shown in A, B were combined. Gray shaded area represents the stimulus interval. Error bars indicate the SEMs obtained using bootstrap. Horizontal lines along the x-axis indicate periods where the incidence of CE is above chance level (p < 0.05; permutation test). D, Distribution of maximum CE recorded with S1 and S2 at the same contralateral location (top), for remote-ipsi (middle), and remote-contra (bottom). Filled colored columns represent neurons with significant CE (permutation test, see Materials and Methods). Gray columns represent neurons with nonsignificant CE. The data illustrate that only very few neurons carried significant CEs when S1 and S2 were spatially separated. E, CEs for neurons that were tested with overlapping and spatially separated S1 and S2 and showed significant CEs. The data illustrate on a cell-by-cell basis that the residual CEs were greatly weakened when the comparison stimuli were spatially separated (N = 23).

Similar articles

Cited by

References

    1. Adachi Y, Osada T, Sporns O, Watanabe T, Matsui T, Miyamoto K, Miyashita Y. Functional connectivity between anatomically unconnected areas is shaped by collective network-level effects in the macaque cortex. Cereb Cortex. 2012;22:1586–1592. doi: 10.1093/cercor/bhr234. - DOI - PubMed
    1. Barbas H. Anatomic organization of basoventral and mediodorsal visual recipient prefrontal regions in the rhesus monkey. J Comp Neurol. 1988;276:313–342. doi: 10.1002/cne.902760302. - DOI - PubMed
    1. Barceló F, Suwazono S, Knight RT. Prefrontal modulation of visual processing in humans. Nat Neurosci. 2000;3:399–403. doi: 10.1038/73975. - DOI - PubMed
    1. Bisley JW, Pasternak T. The multiple roles of visual cortical areas MT/MST in remembering the direction of visual motion. Cereb Cortex. 2000;10:1053–1065. doi: 10.1093/cercor/10.11.1053. - DOI - PubMed
    1. Boch RA, Goldberg ME. Participation of prefrontal neurons in the preparation of visually guided eye movements in the rhesus monkey. J Neurophysiol. 1989;61:1064–1084. - PubMed

Publication types

LinkOut - more resources