. 2016 Sep 7;36(36):9454-71.
doi: 10.1523/JNEUROSCI.0936-16.2016.

Pten Regulates Retinal Amacrine Cell Number by Modulating Akt, Tgfβ, and Erk Signaling

Affiliations

Pten Regulates Retinal Amacrine Cell Number by Modulating Akt, Tgfβ, and Erk Signaling

Nobuhiko Tachibana et al. J Neurosci. .

Abstract

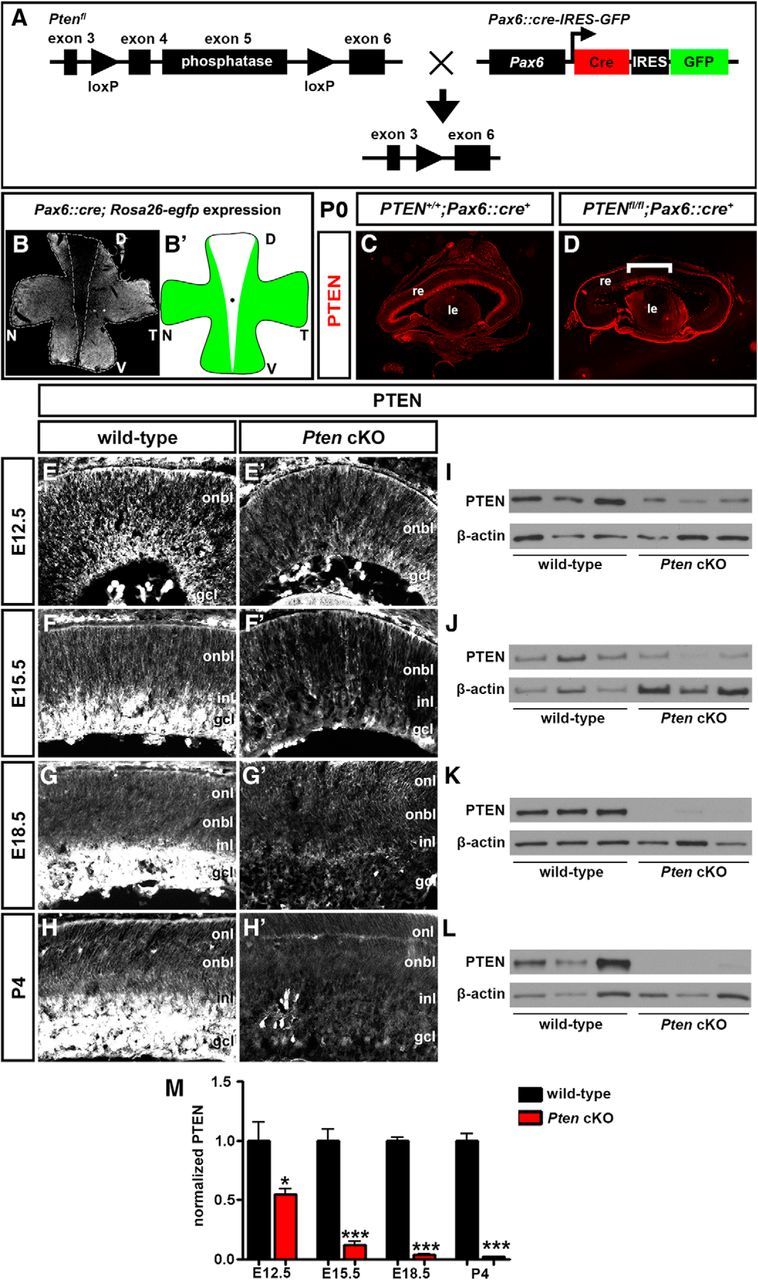
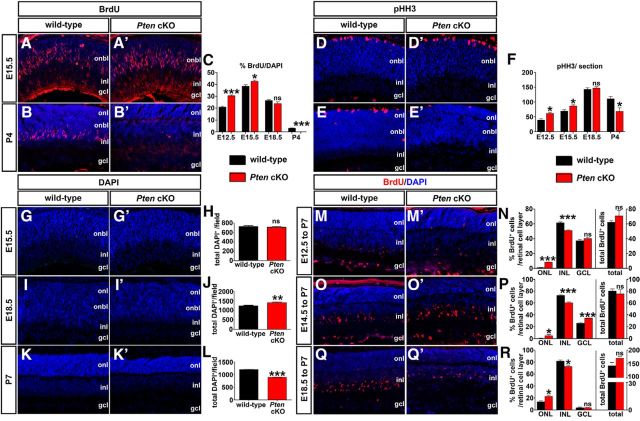
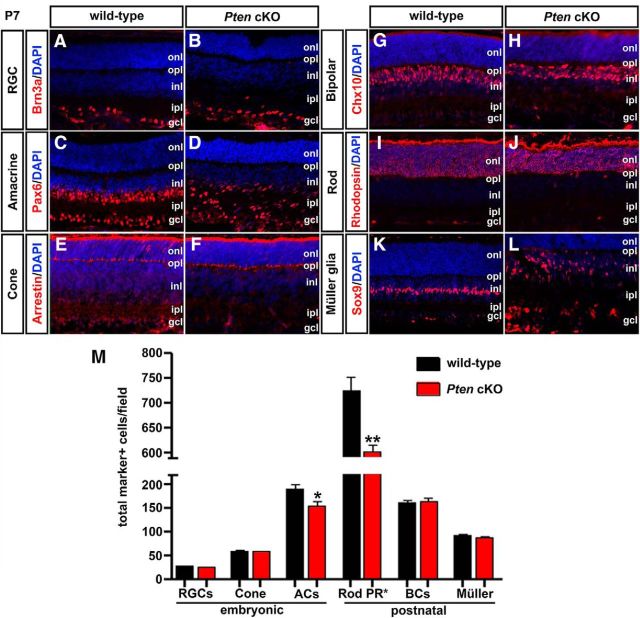
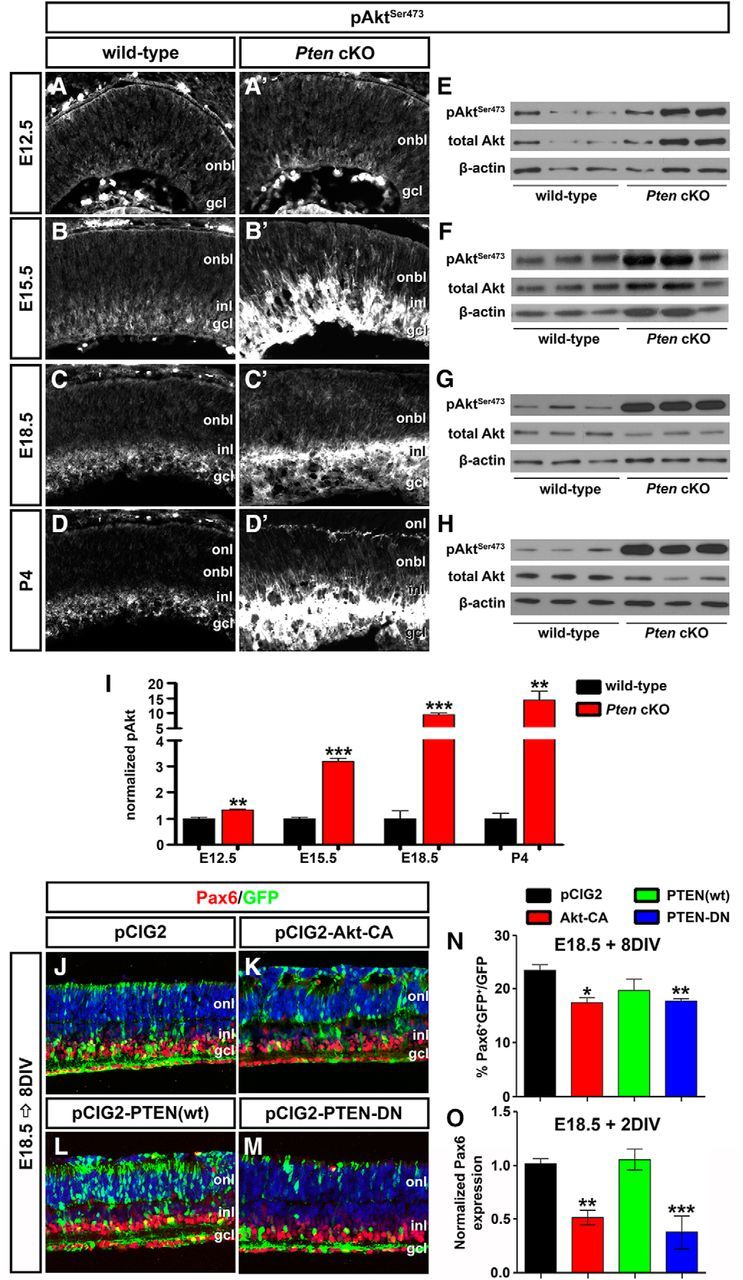
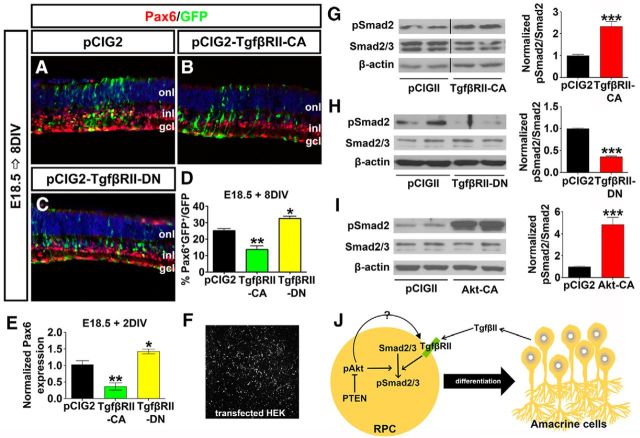
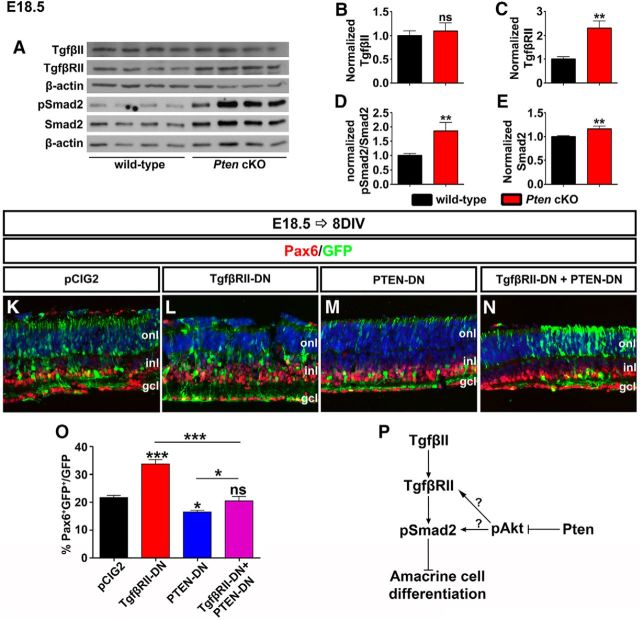
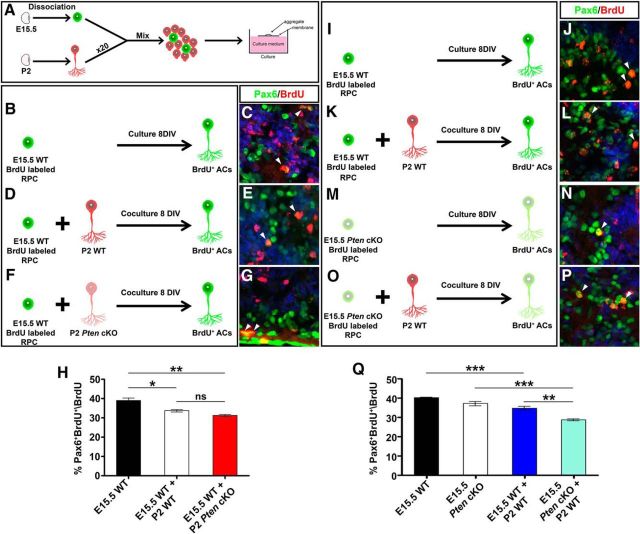
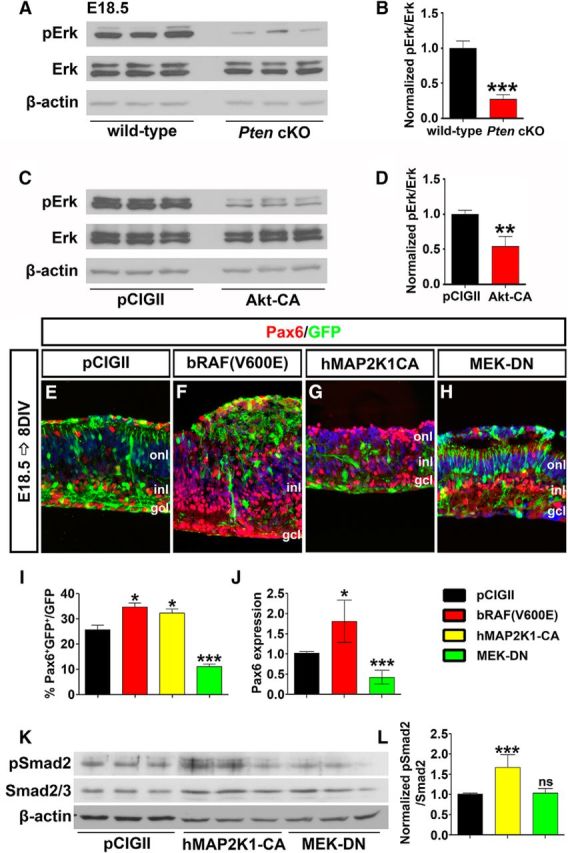
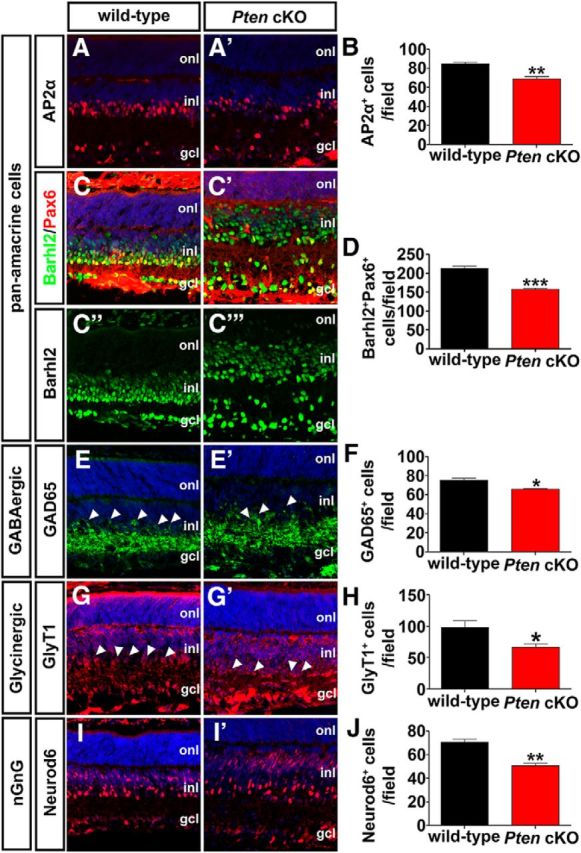
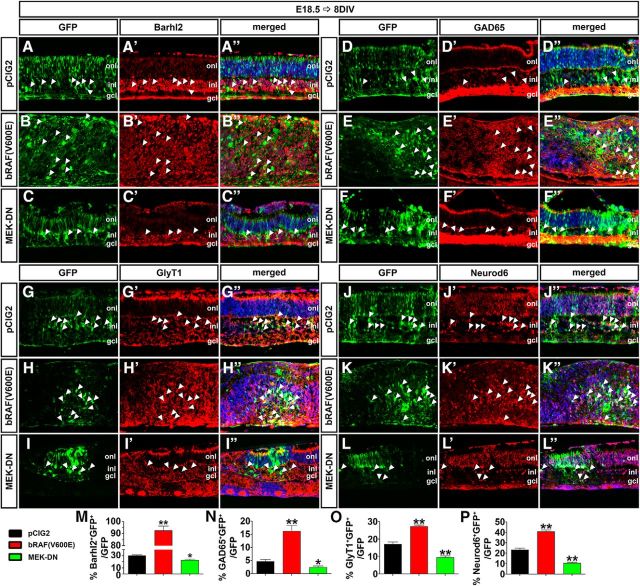
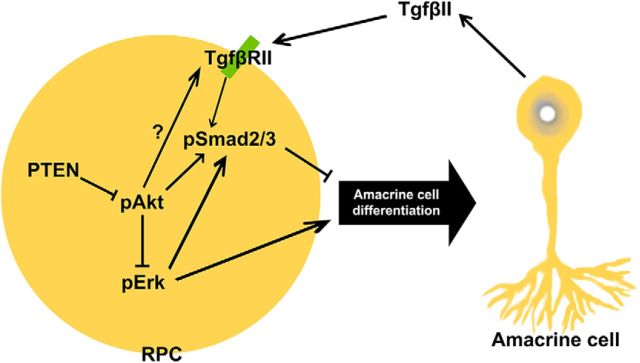
All tissues are genetically programmed to acquire an optimal size that is defined by total cell number and individual cellular dimensions. The retina contains stereotyped proportions of one glial and six neuronal cell types that are generated in overlapping waves. How multipotent retinal progenitors know when to switch from making one cell type to the next so that appropriate numbers of each cell type are generated is poorly understood. Pten is a phosphatase that controls progenitor cell proliferation and differentiation in several lineages. Here, using a conditional loss-of-function strategy, we found that Pten regulates retinal cell division and is required to produce the full complement of rod photoreceptors and amacrine cells in mouse. We focused on amacrine cell number control, identifying three downstream Pten effector pathways. First, phosphoinositide 3-kinase/Akt signaling is hyperactivated in Pten conditional knock-out (cKO) retinas, and misexpression of constitutively active Akt (Akt-CA) in retinal explants phenocopies the reduction in amacrine cell production observed in Pten cKOs. Second, Akt-CA activates Tgfβ signaling in retinal explants, which is a negative feedback pathway for amacrine cell production. Accordingly, Tgfβ signaling is elevated in Pten cKO retinas, and epistatic analyses placed Pten downstream of TgfβRII in amacrine cell number control. Finally, Pten regulates Raf/Mek/Erk signaling levels to promote the differentiation of all amacrine cell subtypes, which are each reduced in number in Pten cKOs. Pten is thus a positive regulator of amacrine cell production, acting via multiple downstream pathways, highlighting its diverse actions as a mediator of cell number control.

Significance statement: Despite the importance of size for optimal organ function, how individual cell types are generated in correct proportions is poorly understood. There are several ways to control cell number, including readouts of organ function (e.g., secreted hormones reach functional levels when enough cells are made) or counting of cell divisions or cell number. The latter applies to the retina, where cell number is regulated by negative feedback signals, which arrest differentiation of particular cell types at threshold levels. Herein, we show that Pten is a critical regulator of amacrine cell number in the retina, acting via multiple downstream pathways. Our studies provide molecular insights into how PTEN loss in humans may lead to uncontrolled cell division in several pathological conditions.

Keywords: Erk; Pten; Tgfβ; amacrine cells; negative feedback signaling; retina.


Figures

Figure 1.
Figure 1.
Generation of a retinal-specific Pten conditional mutation. A, Schematic illustration of crosses between transgenic animals carrying floxed Pten (Ptenfl) and Pax6α/P0::Cre-IRES-GFP transgenes. B, Flat-mount image of Pax6::Cre; Rosa26R-EGFP retina at P0. GFP is not expressed in the central retina. The dotted line outlines the domain where Cre was not active. B′, Schematic illustration of Cre activity domain. C, D, Expression of Pten in P7 wild-type (C) and Pten cKO (D) retinal transverse sections. The bracket in D shows central region where Pten is not deleted and expression is maintained. E–M, Western blot analysis and densitometry of Pten expression levels in wild-type and Pten cKO retinal lysates at E12.5 (E, E′, I), E15.5 (F, F′, J), E18.5 (G, G′, K), and P4 (H, H′, L). Pten levels were reduced at all stages analyzed (M). *p < 0.05; **p < 0.01; ***p < 0.001. D, Dorsal; le, lens; N; nasal, re, retina; T, temporal; V, ventral.
Figure 2.
Figure 2.
Loss of Pten alters proliferation and retinal cell number. A–C, Immunolabeling of wild-type and Pten cKO retinas at E15.5 (A, A′) and P4 (B, B′) for BrdU (red). Blue is a DAPI counterstain. The graph (C) shows the number of BrdU+ cells in wild-type and Pten cKO retinas at E12.5, E15.5, E18.5, and P4. D–F, Immunolabeling of wild-type and Pten cKO retinas at E15.5 (D, D′) and P4 (E, E′) for pHH3 (red). The graph (F) shows the number of pHH3+ cells in wild-type and Pten cKOs at E12.5, E15.5, E18.5, and P4. G–L, DAPI staining of wild-type and Pten cKO retinas at E15.5 (G, G′), E18.5 (I, I′), and P7 (K, K′). The total number of cells in wild-type and Pten cKO retinas at three different stages are shown in the graphs (H, J, L). M–R, Immunolabeling of P7 wild-type and Pten cKO retinas for BrdU after administering at E12.5 (M, M′), E14.5 (O, O′), and E18.5 (Q, Q′). The graphs show the percentages of BrdU+ cells in each retinal layer (left) and the total number of BrdU+ cells (right; N, P, R). *p < 0.05; **p < 0.01; ***p < 0.001.
Figure 3.
Figure 3.
Loss of Pten alters the generation of rod photoreceptors and amacrine cells. A–L, Immunolabeling of wild-type and Pten cKO retinas at P7 for Brn3a (A, B), Pax6 (C, D), cone arrestin (E, F), Chx10 (G, H), rhodopsin (I, J), and Sox9 (K, L). Blue is a DAPI counterstain. M, The graph shows the number of cell-type marker positive cells in wild-type and Pten cKO retinas. *p < 0.05; **p < 0.01. ACs, Amacrine cells; BCs, bipolar cells; PR, photoreceptor.
Figure 4.
Figure 4.
Hyperactivated Akt in Pten cKO retinas contributes to the decline in amacrine cell differentiation. A–D′, Immunolabeling of wild-type and Pten cKO retinas at E12.5 (A, A′), E15.5 (B, B′), E18.5 (C, C′), and P4 (D, D′) for pAktSer473. E–I, Western blot analysis and densitometry of pAktSer473 in wild-type and Pten cKO retinal lysates at E12.5 (E), E15.5 (F), E18.5 (G), and P4 (H). Levels of pAktSer473 are elevated at all stages analyzed when Pten is deleted (I). J–M, E18.5 retinas electroporated with pCIG2 control (J), Akt-CA (K), PTEN(wt) (L), or PTEN-DN (M) and cultured for 8 DIV. GFP+ (green) electroporated amacrine cells were identified by Pax6 immunolabeling (red). Blue is a DAPI counterstain. N, Percentages of GFP+ amacrine cells (GFP+Pax6+) after electroporation of pCIG2, Akt-CA, PTEN(wt), or PTEN-DN. O, qPCR to assess Pax6 transcript levels in GFP+ cells sorted by FACS after electroporation of pCIG2, Akt-CA, PTEN(wt), or PTEN-DN. *p < 0.05; **p < 0.01; ***p < 0.001.
Figure 5.
Figure 5.
Tgfβ signaling is promoted by Akt and acts cell autonomously to block amacrine cell differentiation. A–C, E18.5 retinas electroporated with pCIG2 control (A), TgfβRII-CA (B) or TgfβRII-DN (C) and cultured for 8 DIV. GFP+ (green) electroporated amacrine cells were identified by Pax6 immunolabeling (red). Blue is a DAPI counterstain. D, Percentages of GFP+ amacrine cells (GFP+Pax6+) after electroporation of pCIG2, TgfβRII-CA, or TgfβRII-DN. E, qPCR to assess Pax6 transcript levels in GFP+ cells sorted by FACS after electroporation of pCIG2, TgfβRII-CA, or TgfβRII-DN. F, GFP+ HEK cells 24 h after transfection. G–I, Western blot analysis and densitometry of pSmad2 after transfection of TgfβRII-CA (G), TgfβRII-DN (H), and Akt-CA (I). J, Schematic model of how amacrine cell differentiation is regulated by both Tgfβ and Pten signaling pathways. Note that pAkt could regulate pSmad2 via directly influencing phosphorylation of Smad2 or the upstream receptor TgfβRII. *p < 0.05; **p < 0.01; ***p < 0.001.
Figure 6.
Figure 6.
Pten acts downstream of Tgfβ signaling to control amacrine cell number. A–E, Western blot analysis and densitometry of TgfβII (B), TgfβRII (C), pSmad2 (D), and Smad2 (E) in wild-type and Pten cKO retinal lysates at E18.5. TgfβRII, pSmad2, and Smad2 were significantly increased in Pten cKO retinas. K–N, E18.5 retinas electroporated with pCIG2 control (K), TgfβRII-DN (L), PTEN-DN (M), or in combination (TgfβRII-DN + PTEN-DN; N) and cultured for 8 DIV. GFP+ (green) electroporated amacrine cells were identified by Pax6 immunolabeling (red). Blue is a DAPI counterstain. O, Percentages of GFP+ amacrine cells (GFP+Pax6+) after electroporation of pCIG2, TgfβRII-DN, PTEN-DN or a combination. P, Schematic pathway of how the Tgfβ signaling pathway and Pten/Akt signaling pathway simultaneously regulate amacrine cell differentiation. *p < 0.05; **p < 0.01; ***p < 0.001.
Figure 7.
Figure 7.
Pten acts in RPCs to control responsiveness to amacrine cell negative feedback signals. A, Schematic illustration of aggregation assay protocol. RPCs are shown in green and amacrine cells in red. B–G, The combinations of aggregate conditions are shown in B, D, and F. Immunolabeling of aggregated cell pellets with Pax6 (green) and BrdU (red) is shown with DAPI counterstain (blue). E15.5 RPCs were cultured alone (B, C) or with P2 wild-type (D, E) or Pten cKO (F, G) retinal cells. Arrowheads mark Pax6/BrdU double+ nuclei (C, E, G). H, Percentage of BrdU+ E15.5 cells differentiated into Pax6+ amacrine cells when cultured alone (black bar) or with P2 wild-type (white bar) or Pten cKO (red bar) retinal cells. I–P, Immunolabeling of aggregated cell pellets with Pax6 (green) and BrdU (red) with DAPI counterstain (blue). E15.5 RPCs were cultured alone (I, J) or with P2 wild-type (K, L), and E15.5 Pten cKO RPCs were cultured alone (M, N) or with P2 wild-type (O, P) retinal cells. Arrowheads mark Pax6/BrdU double+ nuclei (J, L, N, P). Q, Percentage of BrdU+ E15.5 cells differentiated into Pax6+ amacrine cells when cultured alone (wild-type, black bar; Pten cKO, white bar) or with P2 wild-type (blue bar, light blue bar) retinal cells. *p < 0.05; **p < 0.01; ***p < 0.001.
Figure 8.
Figure 8.
Pten regulates amacrine cell differentiation via Raf/Mek/Erk signaling. A, B, Western blot analysis (A) and densitometry (B) of pErk in E18.5 wild-type and Pten cKO retinal lysates. C, D, Western blot analysis (C) and densitometry (D) of pErk in Akt-CA transfected HEK cells. Loss of Pten or constitutive activation of Akt reduces pErk levels. E–H, E18.5 retinas electroporated with pCIG2 control (E), bRAF(V600E) (F), hMAP2K1-CA (G), or MEK-DN (H) and cultured for 8 DIV. GFP+ (green) electroporated amacrine cells were identified by Pax6 immunolabeling (red). Blue is a DAPI counterstain. I, Percentages of GFP+ amacrine cells (GFP+Pax6+) after electroporation. J, qPCR to assess Pax6 transcript levels in GFP+ cells sorted by FACS 2 d after electroporation of pCIG2, bRAF(V600E), or MEK-DN. K, L, Western blot analysis (K) and densitometry (L) for pSmad2 24 h after transfection of pCIG2, hMAP2K1-CA, or MEK-DN. *p < 0.05; **p < 0.01; ***p < 0.001.
Figure 9.
Figure 9.
A–J, Pten regulates differentiation of all amacrine cell subtypes. Immunolabeling of P7 wild-type and Pten cKO retinas with antibodies against AP2α (A, A′), Pax6 (C–C‴, green), Barhl2 (C–C‴, red), GAD65 (E, E′), GlyT1 (G, G′), and Neurod6 (I, I′). Barhl2 and Pax6 are colabeled, as ectopic Barhl2 expression is seen in Pten cKO retinas (C′). Blue is a DAPI counterstain. Arrowheads in E,E′,G,G′ mark amacrine cell bodies in the INL. The graphs show the number of AP2α+ (B), Barhl2+Pax6+ (D), GAD65+ (F), GlyT1+ (H), and Neurod6+ (J) cells per field in P7 wild-type and Pten cKO retinas. *p < 0.05; **p < 0.01; ***p < 0.001.
Figure 10.
Figure 10.
Pten regulates amacrine cell differentiation via Erk. A–L″, E18.5 retinas electroporated with pCIG2 control (A–A″, D–D″, G–G″, J–J″), bRAF(V600E) (B–B″, E–E″, H–H″, K–K″), or MEK-DN (C–C″, F–F″, I–I″, L–L″) and cultured for 8 DIV. GFP+ (green) electroporated cells were immunolabled for Barhl2 (A–C″), GAD65 (D–F″), GlyT1 (G–I″), and Neurod6 (J–L″). Arrowheads mark GFP+marker+ double positive cells. M–P, The number of amacrine cells increases when Raf is constitutively active, whereas it decreases when Mek activity is downregulated. *p < 0.05; **p < 0.01.
Figure 11.
Figure 11.
Pten controls amacrine cell production via multiple downstream pathways. Upon TgfβII binding to the receptor on the RPC plasma membrane, Smad2 is activated through phosphorylation. Elevation in pSmad2 levels within RPCs inhibits the acquisition of an amacrine cell fate, and thus amacrine cell production is inhibited. Pten/Akt signaling also leads to elevated Smad2 phosphorylation. Finally, Pten signaling also controls amacrine cell differentiation via Raf/Mek/Erk signaling. Upon activation of Erk, RPCs favor an amacrine cell fate, which will differentiate into all subtypes. Akt signaling blocks this event by inhibition of Erk.

Similar articles

Cited by

References

    1. Akhurst RJ, Padgett RW. Matters of context guide future research in TGFbeta superfamily signaling. Sci Signal. 2015;8:re10. doi: 10.1126/scisignal.aad0416. - DOI - PubMed
    1. Alexiades MR, Cepko CL. Subsets of retinal progenitors display temporally regulated and distinct biases in the fates of their progeny. Development. 1997;124:1119–1131. - PubMed
    1. Alimonti A. PTEN breast cancer susceptibility: a matter of dose. Ecancermedicalscience. 2010;4:192. - PMC - PubMed
    1. Assinder SJ, Dong Q, Kovacevic Z, Richardson DR. The TGF-beta, PI3K/Akt and PTEN pathways: established and proposed biochemical integration in prostate cancer. Biochem J. 2009;417:411–421. doi: 10.1042/BJ20081610. - DOI - PubMed
    1. Backman SA, Stambolic V, Suzuki A, Haight J, Elia A, Pretorius J, Tsao MS, Shannon P, Bolon B, Ivy GO, Mak TW. Deletion of Pten in mouse brain causes seizures, ataxia and defects in soma size resembling Lhermitte-Duclos disease. Nat Genet. 2001;29:396–403. doi: 10.1038/ng782. - DOI - PubMed

Publication types

MeSH terms

Grants and funding