

Neostriatal GABAergic Interneurons Mediate Cholinergic Inhibition of Spiny Projection Neurons
- PMID: 27605623
- PMCID: PMC5013195
- DOI: 10.1523/JNEUROSCI.0466-16.2016
Neostriatal GABAergic Interneurons Mediate Cholinergic Inhibition of Spiny Projection Neurons
Abstract
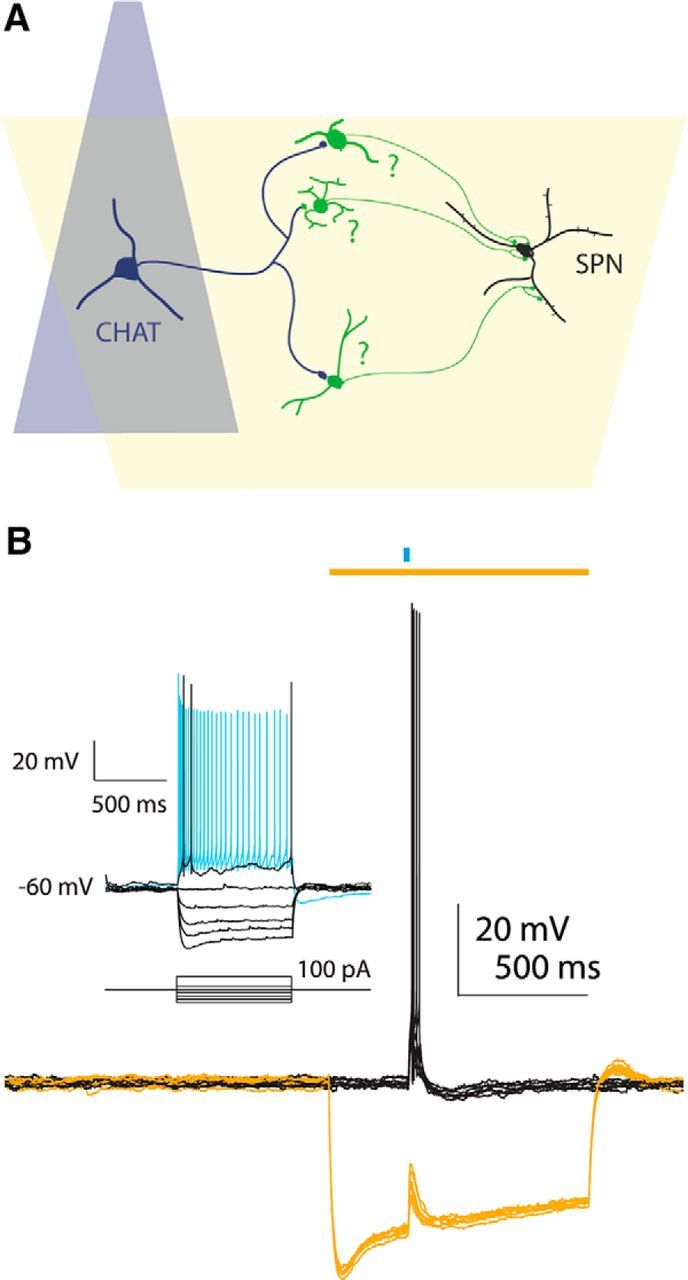
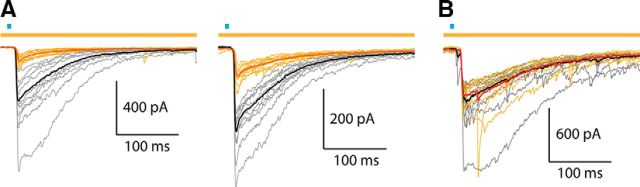
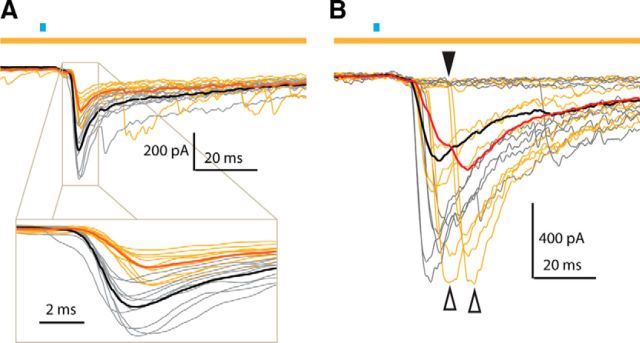
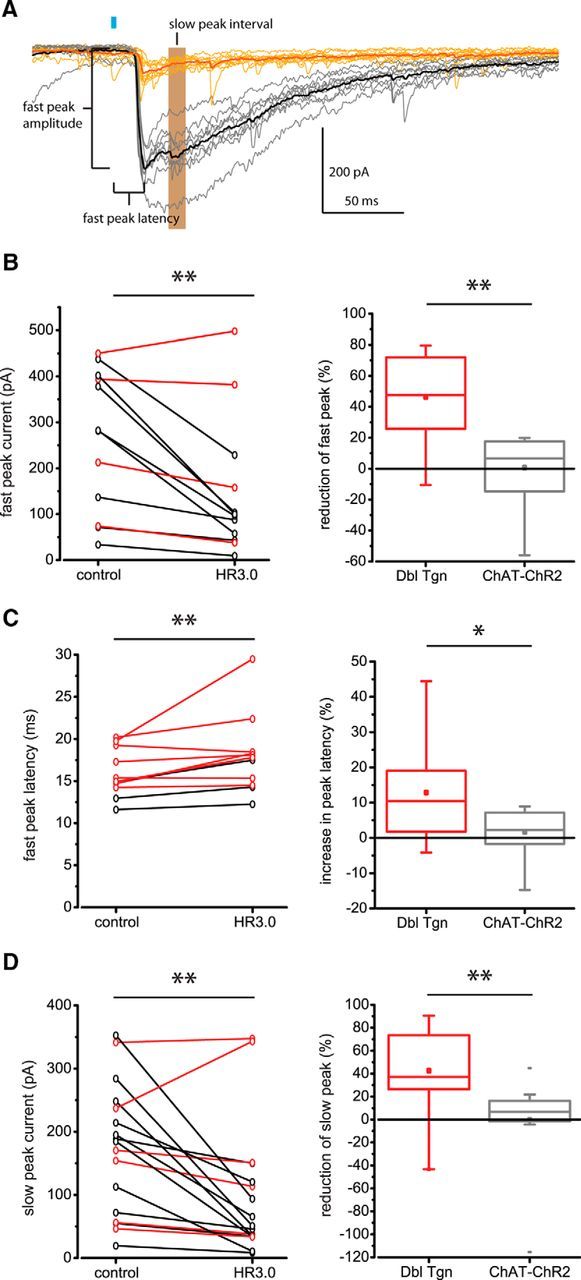
Synchronous optogenetic activation of striatal cholinergic interneurons ex vivo produces a disynaptic inhibition of spiny projection neurons composed of biophysically distinct GABAAfast and GABAAslow components. This has been shown to be due, at least in part, to activation of nicotinic receptors on GABAergic NPY-neurogliaform interneurons that monosynaptically inhibit striatal spiny projection neurons. Recently, it has been proposed that a significant proportion of this inhibition is actually mediated by activation of presynaptic nicotinic receptors on nigrostriatal terminals that evoke GABA release from the terminals of the dopaminergic nigrostriatal pathway. To disambiguate these the two mechanisms, we crossed mice in which channelrhodopsin is endogenously expressed in cholinergic neurons with Htr3a-Cre mice, in which Cre is selectively targeted to several populations of striatal GABAergic interneurons, including the striatal NPY-neurogliaform interneuron. Htr3a-Cre mice were then virally transduced to express halorhodopsin to allow activation of channelrhodopsin and halorhodopsin, individually or simultaneously. Thus we were able to optogenetically disconnect the interneuron-spiny projection neuron (SPN) cell circuit on a trial-by-trial basis. As expected, optogenetic activation of cholinergic interneurons produced inhibitory currents in SPNs. During simultaneous inhibition of GABAergic interneurons with halorhodopsin, we observed a large, sometimes near complete reduction in both fast and slow components of the cholinergic-evoked inhibition, and a delay in IPSC latency. This demonstrates that the majority of cholinergic-evoked striatal GABAergic inhibition is derived from GABAergic interneurons. These results also reinforce the notion that a semiautonomous circuit of striatal GABAergic interneurons is responsible for transmitting behaviorally relevant cholinergic signals to spiny projection neurons.
Significance statement: The circuitry between neurons of the striatum has been recently described to be far more complex than originally imagined. One example of this phenomenon is that striatal cholinergic interneurons have been shown to provide intrinsic nicotinic excitation of local GABAergic interneurons, which then inhibit the projection neurons of the striatum. As deficits of cholinergic interneurons are reported in patients with Tourette syndrome, the normal functions of these interneurons are of great interest. Whether this novel route of nicotinic input constitutes a major output of cholinergic interneurons remains unknown. The study addressed this question using excitatory and inhibitory optogenetic technology, so that cholinergic interneurons could be selectively activated and GABAergic interneurons selectively inhibited to determine the causal relationship in this circuit.
Keywords: GABA-Aslow; cholinergic interneuron; neurogliaform; optogenetics; striatum.
Copyright © 2016 the authors 0270-6474/16/369505-07$15.00/0.
Figures
Similar articles
-
Novel fast adapting interneurons mediate cholinergic-induced fast GABAA inhibitory postsynaptic currents in striatal spiny neurons.Eur J Neurosci. 2015 Jul;42(2):1764-74. doi: 10.1111/ejn.12915. Epub 2015 May 9. Eur J Neurosci. 2015. PMID: 25865337 Free PMC article.
-
Increased GABAergic transmission in neuropeptide Y-expressing neurons in the dopamine-depleted murine striatum.J Neurophysiol. 2020 Apr 1;123(4):1496-1503. doi: 10.1152/jn.00059.2020. Epub 2020 Mar 11. J Neurophysiol. 2020. PMID: 32159408
-
A novel functionally distinct subtype of striatal neuropeptide Y interneuron.J Neurosci. 2011 Nov 16;31(46):16757-69. doi: 10.1523/JNEUROSCI.2628-11.2011. J Neurosci. 2011. PMID: 22090502 Free PMC article.
-
Excitatory extrinsic afferents to striatal interneurons and interactions with striatal microcircuitry.Eur J Neurosci. 2019 Mar;49(5):593-603. doi: 10.1111/ejn.13881. Epub 2018 Mar 25. Eur J Neurosci. 2019. PMID: 29480942 Free PMC article. Review.
-
Dopaminergic Regulation of Striatal Interneurons in Reward and Addiction: Focus on Alcohol.Neural Plast. 2015;2015:814567. doi: 10.1155/2015/814567. Epub 2015 Jul 13. Neural Plast. 2015. PMID: 26246915 Free PMC article. Review.
Cited by
-
Antibodies From Children With PANDAS Bind Specifically to Striatal Cholinergic Interneurons and Alter Their Activity.Am J Psychiatry. 2021 Jan 1;178(1):48-64. doi: 10.1176/appi.ajp.2020.19070698. Epub 2020 Jun 16. Am J Psychiatry. 2021. PMID: 32539528 Free PMC article.
-
Striatal cholinergic interneurons and Parkinson's disease.Eur J Neurosci. 2018 May;47(10):1148-1158. doi: 10.1111/ejn.13638. Epub 2017 Jul 20. Eur J Neurosci. 2018. PMID: 28677242 Free PMC article. Review.
-
Extrinsic and intrinsic control of striatal cholinergic interneuron activity.Front Mol Neurosci. 2025 Feb 13;18:1528419. doi: 10.3389/fnmol.2025.1528419. eCollection 2025. Front Mol Neurosci. 2025. PMID: 40018010 Free PMC article. Review.
-
Cell Type-Specific Membrane Potential Changes in Dorsolateral Striatum Accompanying Reward-Based Sensorimotor Learning.Function (Oxf). 2021 Sep 21;2(6):zqab049. doi: 10.1093/function/zqab049. eCollection 2021. Function (Oxf). 2021. PMID: 35330797 Free PMC article.
-
A tonic nicotinic brake controls spike timing in striatal spiny projection neurons.Elife. 2022 May 17;11:e75829. doi: 10.7554/eLife.75829. Elife. 2022. PMID: 35579422 Free PMC article.
References
Publication types
MeSH terms
Substances
Grants and funding
LinkOut - more resources
Full Text Sources
Other Literature Sources
Molecular Biology Databases
Research Materials
Miscellaneous