. 2016 Oct 28;291(44):23257-23267.
doi: 10.1074/jbc.M116.749747. Epub 2016 Sep 7.

Cross-regulation of Phosphodiesterase 1 and Phosphodiesterase 2 Activities Controls Dopamine-mediated Striatal α-Amino-3-hydroxy-5-methyl-4-isoxazolepropionic Acid (AMPA) Receptor Trafficking

Affiliations

Cross-regulation of Phosphodiesterase 1 and Phosphodiesterase 2 Activities Controls Dopamine-mediated Striatal α-Amino-3-hydroxy-5-methyl-4-isoxazolepropionic Acid (AMPA) Receptor Trafficking

Roy S Song et al. J Biol Chem. .

Abstract

Dopamine, a key striatal neuromodulator, increases synaptic strength by promoting surface insertion and/or retention of AMPA receptors (AMPARs). This process is mediated by the phosphorylation of the GluA1 subunit of AMPAR by cyclic nucleotide-dependent kinases, making cyclic nucleotide phosphodiesterases (PDEs) potential regulators of synaptic strength. In this study, we examined the role of phosphodiesterase 2 (PDE2), a medium spiny neuron-enriched and cGMP-activated PDE, in AMPAR trafficking. We found that inhibiting PDE2 resulted in enhancement of dopamine-induced surface GluA1 expression in dopamine receptor 1-expressing medium spiny neurons. Using pharmacological and genetic approaches, we found that inhibition of PDE1 resulted in a decrease in surface AMPAR levels because of the allosteric activation of PDE2. The cross-regulation of PDE1 and PDE2 activities results in counterintuitive control of surface AMPAR expression, making it possible to regulate the directionality and magnitude of AMPAR trafficking.

Keywords: AMPA receptor (AMPAR); GluA1; PDE1; PDE2; cAMP; cGMP; dopamine; phosphodiesterases; trafficking.


Figures

FIGURE 1.
FIGURE 1.
PDE2 inhibition enhances D1R agonist-induced GluA1 surface expression. Data are represented as mean ± S.E. normalized to baseline. A, D1R agonist (0.1 μm A68930) was added for 10 min, followed by DMSO (gray, 27 cells) or PDE2 inhibitor (1.0 μm BAY60-7550, black, 15 cells). ***, p < 0.0001 (repeated measures two-way ANOVA, F1,19 = 24.23). B, BAY60-7550 alone has no effect on GluA1 surface insertion. 1.0 μm BAY60-7550 was added after 5 min of baseline. (four cells). C, PDE2 inhibition increases D1R agonist-induced cAMP production. 0.1 μm A68930 was added after 5 min of baseline, followed by DMSO (gray, 17 cells) or 1.0 μm BAY60-7550 (black, 11 cells). *, p = 0.0041 (repeated measures two-way ANOVA, F1,26 = 9.906).
FIGURE 2.
FIGURE 2.
Allosteric PDE2 activation by cGMP modulates GluA1 surface expression. A, diagram of model topology of PDE1/2 regulation of GluA1 surface insertion in D1R MSNs. Arrows and plungers indicate activation/production and inhibition/degradation, respectively. Species in red represent pharmacological agents used. B, cGMP level controls GluA1 surface insertion by enhancing PDE2 activity. Shown is a simulation comparison of GluA1 surface insertion time courses. C, varying cGMP and PDE2 concentrations affects GluA1 surface insertion. cGMP (x axis) and PDE2 (y axis) concentrations were varied from 0.0–1.0 μm. The resulting GluA1 surface insertion time courses were plotted, and the AUC value was calculated. AUC values were color-coded so that an increase over control (DA alone) is red, a decrease is blue, and a value equal to control is white. D, varying PDE1 and PDE2 concentrations affects GluA1 surface insertion. PDE1 (x axis) and PDE2 (y axis) concentrations were varied from 0.0–1.0 μm. AUC values are color-coded.
FIGURE 3.
FIGURE 3.
Increasing cGMP production reduces D1R agonist-induced cAMP levels and GluA1 surface expression by activating PDE2. Data are represented as mean ± S.E. normalized to baseline. A, SNAP significantly increases cGMP levels. 0.1 μm A68930 was added after 5 min of baseline, followed by DMSO (gray, eight cells) or 50 μm SNAP (black, eight cells). ***, p = 0.0001 (repeated measures two-way ANOVA, F1,19 = 27.00). B, increasing cGMP production decreases D1R agonist-induced cAMP levels via modulation of PDE2. After 5 min of baseline, 0.1 μm A68930 was added for 10 min, followed by DMSO (replotted from Fig. 1 for comparison) or 50 μm SNAP (black, 21 cells) or 1.0 μm BAY60-7550 + 50 μm SNAP (black open square, seven cells). ***, p = 0.0009 (repeated measures two-way ANOVA, DMSO versus SNAP, F1,36 = 25.84); p < 0.0001 (repeated measures two-way ANOVA, SNAP versus SNAP + BAY60-7550, F1,26 = 74.03). C, increasing cGMP reduces GluA1 surface expression by activating PDE2. After 5 min of baseline, the D1R agonist A68930 (0.1 μm) was added for 10 min, followed by DMSO (replotted from Fig. 1 for comparison) or 50 μm SNAP (black squares, 11 cells) or 1.0 μm BAY60-7550 + 50 μm SNAP (black open squares, 10 cells). ***, p < 0.0001 (repeated measures two-way ANOVA, DMSO versus SNAP, F1,36 = 26.31). **, p = 0.0061 (two-way ANOVA, SNAP versus BAY60-7550 + SNAP, F1,19 = 9.50). D, SNAP alone has no effect on GluA1 surface insertion. 50 μm SNAP was added after 5 min of baseline (six cells).
FIGURE 4.
FIGURE 4.
PDE1 inhibition decreases D1R agonist-induced cAMP levels and GluA1 surface insertion by activating PDE2. Data are represented as mean ± S.E. normalized to baseline. A, PDE1 inhibition increases cGMP levels. 0.1 μm A68930 was added after 5 min of baseline, followed by DMSO (replotted from Fig. 3 for comparison) or 10 μm MMPX (black, 11 cells). *, p = 0.0373 (repeated measures two-way ANOVA, F1,17 = 5.11). B, PDE1 inhibition by MMPX decreases D1R agonist-induced cAMP levels. 0.1 μm A68930 was added for 10 min, followed by DMSO (replotted from Fig. 1 for comparison) or 10 μm MMPX (black, 14 cells) or 1.0 μm BAY60-7550 + 10 μm MMPX (black open squares, 11 cells). **, p = 0.0015 (repeated measures two-way ANOVA, DMSO versus MMPX, F1,29 = 12.39). ***, p < 0.0001 (repeated measures two-way ANOVA, MMPX versus MMPX + BAY60-7550, F1,22 = 25.61). C, PDE1 inhibition reduces GluA1 surface levels. The D1R agonist A68930 (0.1 μm) was added for 10 min, followed by DMSO (gray, 12 cells) or the PDE1 inhibitor MMPX (10 μm, black filled squares, 10 cells), or 1.0 μm BAY60-7550 + 10 μm MMPX (black open squares, 11 cells). **, p = 0.0016 (repeated measures two-way ANOVA, DMSO versus MMPX, F1,20 = 13.40). ***, p = 0.0005 (repeated measures two-way ANOVA, F1,19 = 17.29). D, expression of PDE2 mutants abolished PDE1 regulation of GluA1 surface insertion. Expression of PDE2 lacking catalytic activity (PDE2DN, gray squares, 15 cells) or allosteric regulation by cGMP (PDE2D485A, open circles; 14 cells) increases GluA1 surface insertion in the presence of 10 μm MMPX. ***, p < 0.0001 (repeated measures two-way ANOVA, MMPX versus PDE2DN, F1,23 = 27.70). ***, p = 0.0002 (repeated measures two-way ANOVA, MMPX versus PDE2D485A, F1,22 = 20.15).
FIGURE 5.
FIGURE 5.
Activation of PDE2 decreases surface GluA1 levels. Data are represented as mean ± S.E. normalized to baseline. A, increasing cGMP levels is inversely proportional to surface GluA1 expression in D1 MSNs. The graph relates cGMP levels induced by SNAP or MMPX (Figs. 3A and 4A) and surface GluA1 (Figs. 3C and 4C). B, LA-PDE2 activation by 650-nm light induces a decrease in cAMP levels. 12.5 μm forskolin was added after a 5-min baseline, followed by exposure to no light (black circles, 10 cells) or to red light (min 10–12, gray squares, 12 cells). **, p = 0.0011 (repeated measures two-way ANOVA, F1,20 = 14.65). C, LA-PDE2 activation by 650-nm light induces a decrease in surface GluA1 levels. 0.1 μm A68930 was added after a 5-min baseline, followed by exposure to no light (black circles, 12 cells) or to red light (min 10–12, gray squares, six cells). *, p = 0.0294 (repeated measures two-way ANOVA, F1,20 = 7.13).
FIGURE 6.
FIGURE 6.
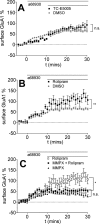
PDE1/PDE2 cross-talk regulation of surface GluA1 levels is not dependent on PDE10 or PDE4 and is specific for GluA1. Data are represented as mean ± S.E. normalized to baseline. A, PDE10 inhibition has no effect on D1R agonist-induced GluA1 surface insertion. 0.1 μm A68930 was added for 10 min, followed by DMSO (replotted from Fig. 1 for comparison) or the PDE10 inhibitor TC-E5005 (10 μm, black triangles, seven cells). n.s., p = 0.3658 (repeated measures two-way ANOVA, F1,32 = 0.84). B, PDE4 inhibition enhances surface GluA1 levels induced by D1R agonist treatment. 0.1 μm A68930 was added for 10 min, followed by DMSO (replotted from Fig. 1 for comparison) or the PDE4 inhibitor rolipram (10 μm, black squares, six cells). **, p = 0.0019 (repeated measures two-way ANOVA, DMSO versus rolipram, F1,31 =11.47). C, PDE4 inhibition fails to rescue the PDE1 inhibition-induced decrease in surface GluA1 levels. 0.1 μm A68930 was added for 10 min, followed by MMPX (replotted from Fig. 4 for comparison), rolipram (replotted from Fig. 6B for comparison), or MMPX + rolipram (black triangles, 10 cells). n.s., p = 0.1708 (repeated measures two-way ANOVA, F1,20 = 2.02).
FIGURE 7.
FIGURE 7.
PDE1/PDE2 cross-talk regulates surface GluA1 surface expression in adult striatal tissue. A, treatment with a PDE2 inhibitor potentiates the D1-induced increase in surface GluA1 expression. Acute mouse striatal slices were treated for 30 min under the following conditions: DMSO, 1.0 μm A68930, or 1.0 μm A68930 + 10 μm BAY60-7550. Surface GluA1 and total GluA1 expression are shown. GAPDH was used as a loading CT. B, densitometry of the immunoblots shown in A. Significance was analyzed using one-way ANOVA followed by Tukey's post hoc test (DMSO versus A68930: *, p = 0.0154; DMSO versus A68930 + BAY60-7550: **, p = 0.0071; A68930 versus A68930 + BAY60-7550: *, p = 0.0402; n = 7). C, treatment with a PDE1 inhibitor decreases the D1-induced increase in surface GluA1 expression. Acute mouse striatal slices were treated for 30 min under the following conditions: DMSO, 0.1 μm A68930, 1.0 μm A68930 + 100 μm MMPX, or 1.0 μm A68930 + 10 μm BAY60-7550 + 100 μm MMPX for 30 min. Surface GluA1 and total GluA1 expression are shown. GAPDH was used as a loading CT. D, densitometry of the immunoblots shown in C. Significance was analyzed using one-way ANOVA followed by Tukey's post hoc test (DMSO versus A68930: *, p = 0.0496; DMSO versus A68930 + MMPX: n.s., p = 0.9683; DMSO versus A68930 + MMPX + BAY60-7550: *, p = 0.0438; A68930 versus A68930 + MMPX: *, p = 0.0336; A68930 versus A68930 + MMPX + BAY60-7550: n.s., p = 0.8937; A68930 + MMPX versus A68930 + MMPX + BAY60-7550: *, p = 0.0347).

Similar articles

Cited by

References

    1. Carlezon W. A. Jr., and Thomas M. J. (2009) Biological substrates of reward and aversion: a nucleus accumbens activity hypothesis. Neuropharmacology 56, 122–132 - PMC - PubMed
    1. Graybiel A. M. (2005) The basal ganglia: learning new tricks and loving it. Curr. Opin. Neurobiol. 15, 638–644 - PubMed
    1. Surmeier D. J., Ding J., Day M., Wang Z., and Shen W. (2007) D1 and D2 dopamine-receptor modulation of striatal glutamatergic signaling in striatal medium spiny neurons. Trends Neurosci. 30, 228–235 - PubMed
    1. Tritsch N. X., and Sabatini B. L. (2012) Dopaminergic modulation of synaptic transmission in cortex and striatum. Neuron 76, 33–50 - PMC - PubMed
    1. Snyder G. L., Allen P. B., Fienberg A. A., Valle C. G., Huganir R. L., Nairn A. C., and Greengard P. (2000) Regulation of phosphorylation of the GluR1 AMPA receptor in the neostriatum by dopamine and psychostimulants in vivo. J. Neurosci. 20, 4480–4488 - PMC - PubMed

Publication types

MeSH terms

Substances

LinkOut - more resources