. 2016 Aug 24:10:69.
doi: 10.3389/fncir.2016.00069. eCollection 2016.

In vivo Whole-Cell Recordings Combined with Electron Microscopy Reveal Unexpected Morphological and Physiological Properties in the Lateral Nucleus of the Trapezoid Body in the Auditory Brainstem

Affiliations

In vivo Whole-Cell Recordings Combined with Electron Microscopy Reveal Unexpected Morphological and Physiological Properties in the Lateral Nucleus of the Trapezoid Body in the Auditory Brainstem

Tom P Franken et al. Front Neural Circuits. .

Abstract

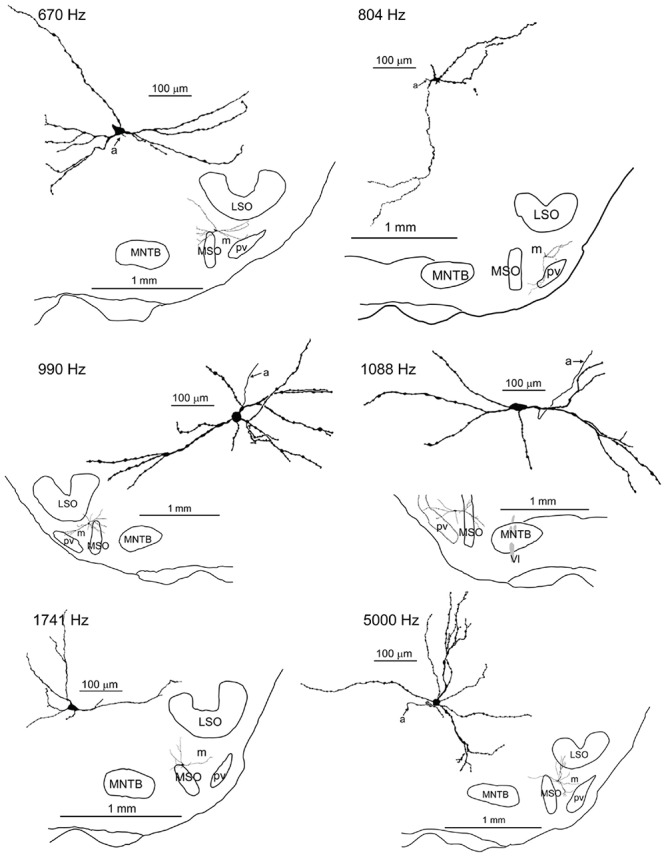
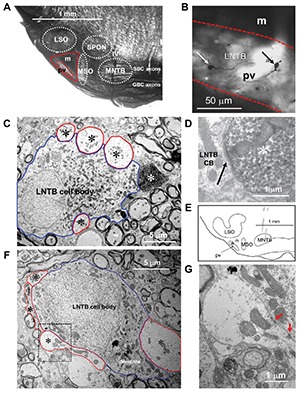
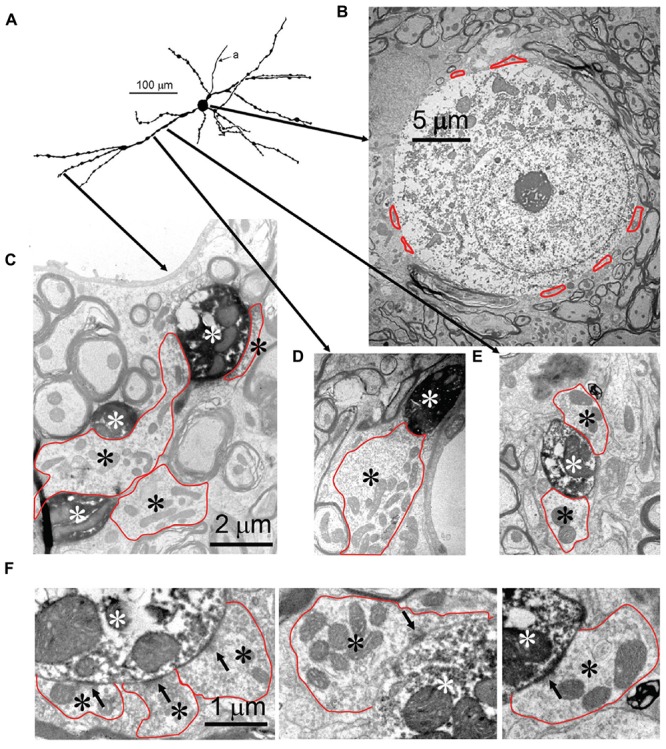
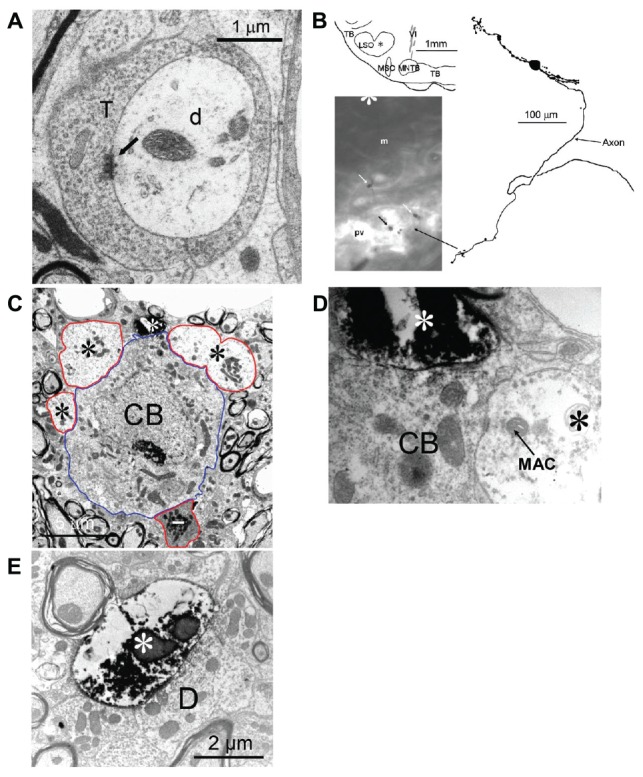
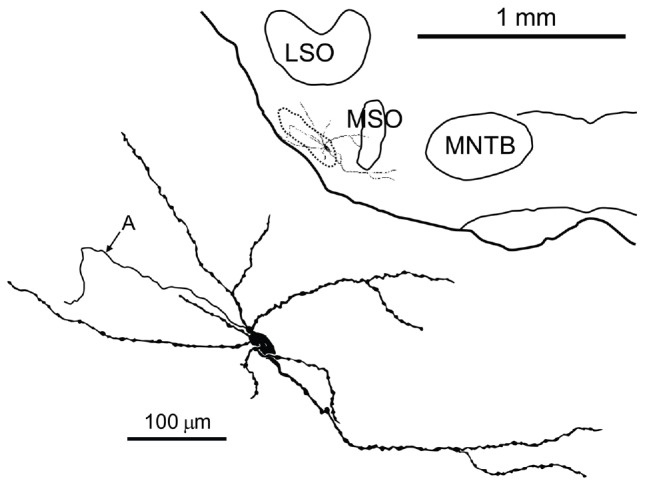
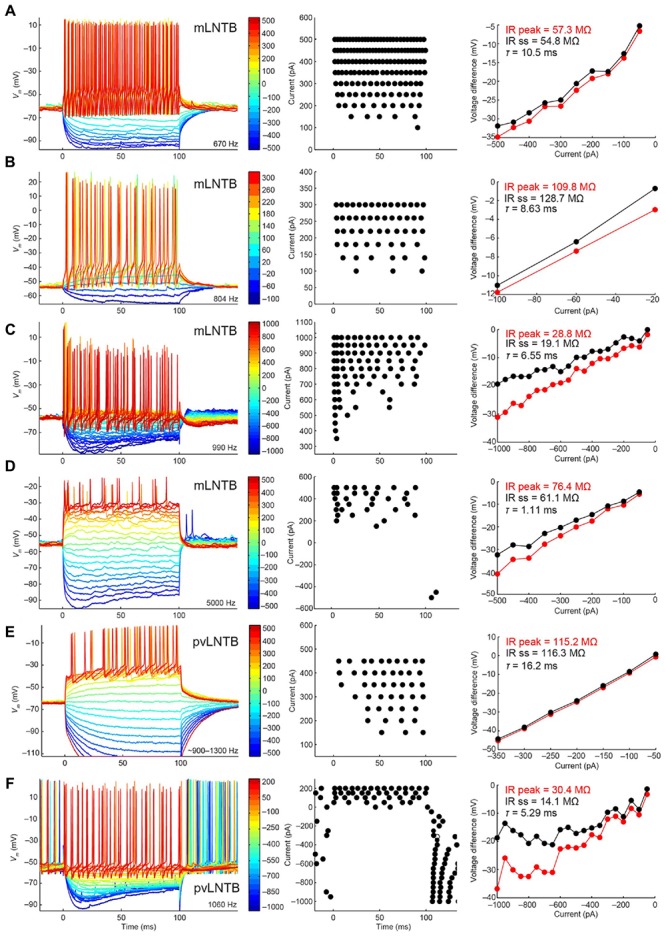
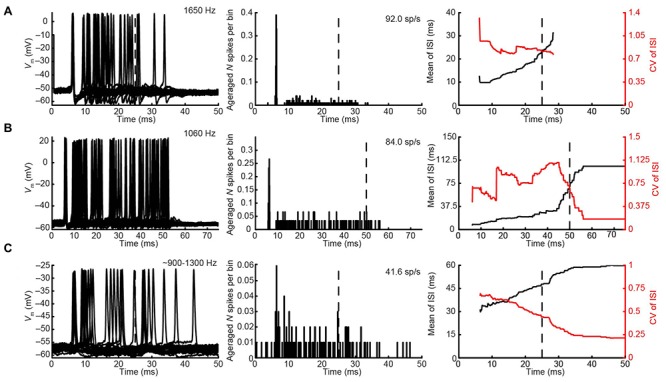
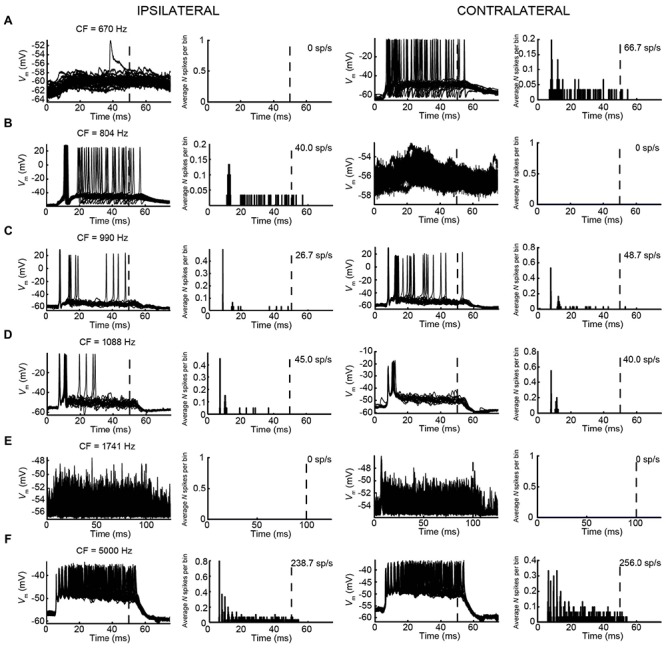
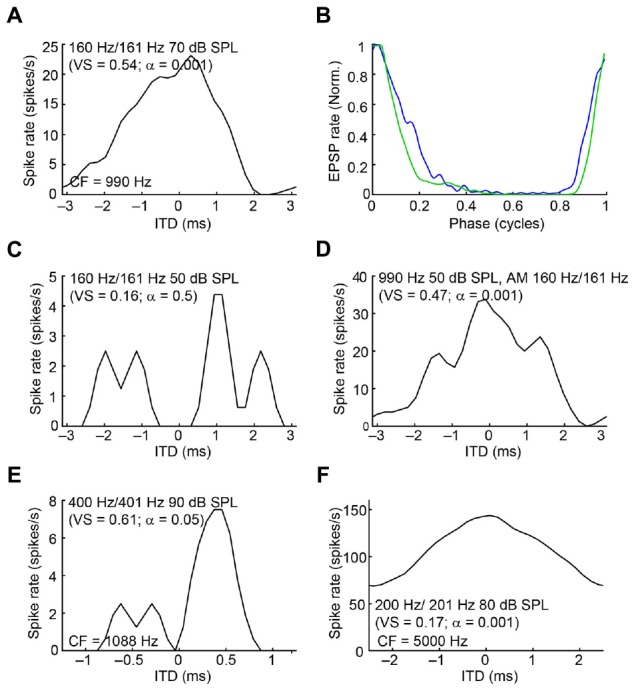
The lateral nucleus of the trapezoid body (LNTB) is a prominent nucleus in the superior olivary complex in mammals including humans. Its physiology in vivo is poorly understood due to a paucity of recordings. It is thought to provide a glycinergic projection to the medial superior olive (MSO) with an important role in binaural processing and sound localization. We combined in vivo patch clamp recordings with labeling of individual neurons in the Mongolian gerbil. Labeling of the recorded neurons allowed us to relate physiological properties to anatomy at the light and electron microscopic level. We identified a population of quite dorsally located neurons with surprisingly large dendritic trees on which most of the synaptic input impinges. In most neurons, one or more of these dendrites run through and are then medial to the MSO. These neurons were often binaural and could even show sensitivity to interaural time differences (ITDs) of stimulus fine structure or envelope. Moreover, a subpopulation showed enhanced phase-locking to tones delivered in the tuning curve tail. We propose that these neurons constitute the gerbil main LNTB (mLNTB). In contrast, a smaller sample of neurons was identified that was located more ventrally and that we designate to be in posteroventral LNTB (pvLNTB). These cells receive large somatic excitatory terminals from globular bushy cells. We also identified previously undescribed synaptic inputs from the lateral superior olive. pvLNTB neurons are usually monaural, display a primary-like-with-notch response to ipsilateral short tones at CF and can phase-lock to low frequency tones. We conclude that mLNTB contains a population of neurons with extended dendritic trees where most of the synaptic input is found, that can show enhanced phase-locking and sensitivity to ITD. pvLNTB cells, presumed to provide glycinergic input to the MSO, get large somatic globular bushy synaptic inputs and are typically monaural with short tone responses similar to their primary input from the cochlear nucleus.

Keywords: ITD; LNTB; LSO; Mongolian gerbil; mLNTB; patch clamp; phase-locking; pvLNTB.


Figures

FIGURE 1
FIGURE 1
Camera lucida drawings of six labeled neurons in the mLNTB. The CF is indicated for each neuron. Insets show the location of the labeled unit on a coronal brainstem section. a, axon.
FIGURE 2
FIGURE 2
Macroscopic and microscopic identification of pvLNTB. (A) Plastic-embedded coronal section of gerbil brainstem showing the location of the main nuclei (white dotted outlines) embedded within the large bundle of axons known as the TB arising primarily from globular and spherical bushy cells in the cochlear nucleus. The area lateral to the MSO and ventral to the LSO (red solid line) is designated the LNTB. The area enclosed by the dotted red line is referred to as pvLNTB while the remaining dorsal, darker area is mLNTB. (B) Swellings (arrows) of labeled GBC axons within the pvLNTB (pv; red dotted lines). m: mLNTB (C) Electron micrograph of one of the labeled swellings (white asterisk) shown in B confirming that it is a synaptic terminal synapsing on a cell body in pvLNTB (blue outline) adjacent to other large unlabeled terminals (red outlines, black asterisks). (D) Synaptic specialization (arrow) of the labeled terminal in C. (E) Location of one of our physiologically characterized, labeled neurons (asterisk) in pvLNTB (outline). (F) Electron micrograph of the labeled pvLNTB cell body (blue outline) whose location is shown in E. Red outlines and asterisks show the large unlabeled synaptic terminals ending on this cell. (G) Enlarged view of the area outlined by a black dotted line in F showing synaptic specializations (red arrows).
FIGURE 3
FIGURE 3
Synaptic inputs to an mLNTB cell. (A) Camera lucida drawing of the mLNTB cell. CF = 990 Hz. For its location in the SOC: see Figure 1. (B) Cell body. Red dotted outlines indicate synaptic terminals. (C–E) Electron micrographs illustrate the presence of large synaptic terminals (black asterisks, red outlines) on dendrites (white asterisks) at the location of the arrow origins shown in (A). (F) Examples of synaptic specializations (arrows) at higher magnification seen in (C–F) or in adjacent sections.
FIGURE 4
FIGURE 4
Connections between the LNTB, SPON and LSO. (A) Synaptic terminal of an mLNTB cell axon collateral on a dendrite in the SPON. Arrow indicates synaptic specialization. T: mLNTB synaptic terminal; d: SPON dendrite. (B–E) The LSO projects to the LNTB. (B) Efferents from a labeled LSO neuron form large endings in the pvLNTB. Top left: Location of the LSO cell body. Right: Camera lucida drawing of the LSO principal cell. The main axon initially headed ventrally then turned medially on its way to the ipsilateral IC. Bottom left: at the point where the main axon turns medially an axon collateral is given off that heads ventrally into the LNTB. The swellings seen toward the end of this collateral are indicated with arrows. (C) Electron micrograph of one of the swellings of the LSO axon collateral, shown in A, synapsing (white asterisk at 12 o’clock) on a pvLNTB cell body (blue outline) that is also contacted by several large presynaptic terminals (red outlines, black asterisks). Larger profiles of the LSO terminal seen in adjacent sections are not shown. Also contacting the cell body is what appears to be an inhibitory terminal with a darker axoplasm (red outline, white dash). (D) Enlarged electron micrograph of the same labeled LSO axon terminal (white asterisk) shown in (C) synapsing on a pvLNTB cell body (CB), immediately adjacent to a large unlabeled terminal (black asterisk) that contains a structure resembling a “mitochondrial-associated adherens complex” (MAC). MACs are also found in cat GBC axon terminals in pvLNTB (Spirou et al., 1998). (E) Electron micrograph of another LSO axon terminal (white asterisk) synapsing on a large dendrite (D) in pvLNTB.
FIGURE 5
FIGURE 5
Camera lucida drawing of a labeled neuron in the pvLNTB with an extensive dendritic tree. Inset shows the location of the labeled cell on a coronal brainstem section. A, axon; LSO, lateral superior olive; MNTB, medial nucleus of the TB; MSO, medial superior olive.
FIGURE 6
FIGURE 6
Spontaneous activity of LNTB neurons. CF is indicated when known. (A) Spontaneous activity in a pvLNTB neuron. Black asterisks: spike afterhyperpolarization shows double undershoot, as described in gerbil slice (Roberts et al., 2014). Red asterisks: IPSPs. Green asterisks: EPSPs. Green arrow: EPSP that results in an action potential. (B) Spontaneous activity in another pvLNTB neuron. Symbols as in (A). (C,D) Spontaneous activity in two mLNTB neurons. Symbols as in (A).
FIGURE 7
FIGURE 7
Voltage response to current steps for LNTB neurons. Voltage response to current injections is shown for six neurons: four mLNTB neurons (A–D) and two pvLNTB neurons (E,F). Left panels show voltage responses to hyperpolarizing and depolarizing current steps (color legend shows current amplitude in pA). Middle panels are dot rasters showing the action potentials from the left panels. Right panels are IV plots of the hyperpolarizing responses from the left panels, plotted separately for the peak and steady state response. The peak and steady state input resistance (IR) as well as the membrane time constant (τ) are mentioned in each panel. The bridge was sometimes not well-balanced, especially for the cell shown in (E). A post hoc calculation of the resistance showed that the true series resistance for this cell is about 108.6 MΩ (the bridge was balanced for 75.7 MΩ). The input resistance mentioned in (E) was corrected for this value.
FIGURE 8
FIGURE 8
Ipsilateral responses to short tones at CF for 3 pvLNTB neurons. (A–C) Each row corresponds to one pvLNTB neuron. Left panels: stacked intracellular responses to 20 repetitions of short monaural ipsilateral tones at CF. CF is indicated when known; for the neuron in C a frequency tuning function was not available but a CF-range is estimated from the response latency to short tones. For this neuron responses to 900 Hz tones are shown. Middle panels: PSTH. Bin size = 0.1 ms. Spike rate is indicated. Right panels: mean (black line) and CV (red line) of ISIs. The neuron in C corresponds to that in Figure 5. Stimulus SPL and number of repetitions for the PSTH (middle column) were; (A) 80 dB SPL/100 repetitions, (B) 75 dB SPL/30 repetitions, (C) 90 dB SPL/100 repetitions.
FIGURE 9
FIGURE 9
Responses of mLNTB neurons to short tones at CF. Vm (left) and PSTH (right) of responses to ipsilateral (two leftmost columns) and contralateral (two rightmost columns) short tones at CF for 6 mLNTB neurons. Bin size = 0.1 ms. Spike rate is indicated for each response. (A) 80 dB SPL/30 repetitions; (B) 85 dB SPL/30 repetitions; (C) 80 dB SPL/30 repetitions; (D) 70 dB SPL/20 repetitions; (E) 70 dB SPL/50 repetitions; (F) 70 dB SPL/30 repetitions.
FIGURE 10
FIGURE 10
Regularity analysis of mLNTB responses to short tones at CF. (A–F) Mean (black line) and CV (red line) of ISIs of responses to monaural tones at CF, for the corresponding neurons in Figure 9. N.S., no spikes.
FIGURE 11
FIGURE 11
Inhibitory features in responses to sound of mLNTB neurons. (A–E) Stacked responses to monaural stimuli for 5 mLNTB neurons. Stimuli are shown in blue (ipsilateral stimulation) or green (contralateral stimulation). Number of repetitions shown: (A) 5; (B) 3; (C) 1; (D) 1; (E) 3.
FIGURE 12
FIGURE 12
Phase-locking of pvLNTB neurons to tones. (A) Stacked responses of a pvLNTB neuron to 400 Hz tones at 60 dB SPL (CF = 1650 Hz). Red dots indicate stimulus periods. VS is 0.78 (α ≤ 0.001). (B) Responses of another pvLNTB neuron (CF = 1060 Hz) to 300 Hz tones at 50 dB SPL. VS is 0.91 (α ≤ 0.001). (C–F) VS as a function of stimulus frequency for four pvLNTB neurons. (C) Corresponds to the neuron in (A,D) corresponds to the neuron in (B). Filled symbols correspond to data with significant phase-locking. Colors indicate sound levels (scale in F). CF, if known, is indicated in the panel. Note that the ordinate uses an expansive, approximately isovariance, scale, where (1-VS) is plotted on an inverted log axis (Johnson, 1980; Joris et al., 1994a). Dashed horizontal line indicates a VS of 0.9.
FIGURE 13
FIGURE 13
Phase-locking of mLNTB neurons to tones. Left column: responses to ipsilateral tones. Right column: responses to contralateral tones. (A,B) Vm traces for two neurons; (C–E) plots of VS for three neurons. (A) Stacked responses to ipsilateral (left) and contralateral (right) tones of 210 Hz at 90 dB SPL (CF = 1088 Hz). Red dots indicate stimulus periods. VS is 0.94 (α ≤ 0.001) for ipsilateral stimulation and 0.96 (α ≤ 0.001) for contralateral stimulation. (B) Similar to (A), for another neuron (CF = 1741 Hz), for tones of 309 Hz at 70 dB SPL. (C) VS as a function of stimulus frequency, for the neuron in (A). Filled symbols correspond to data with significant phase-locking. Colors indicate sound levels (scale in E). CF is indicated in the left panel. Dashed line indicates a VS of 0.9. (D,E) Similar to (C), for other mLNTB neurons. The neuron in (E) corresponds to the neuron in (B).
FIGURE 14
FIGURE 14
ITD tuning of mLNTB neurons. (A) ITD function of an mLNTB neuron in response to a binaural beat stimulus (160 Hz/161 Hz, 70 dB SPL) (B) Cycle histograms of subthreshold EPSPs from the neuron in A in response to monaural tones corresponding to the binaural beat stimulus used in A (green: response to contralateral stimulus, blue: response to ipsilateral stimulus). (C) ITD function of the neuron in A to the same binaural beat stimulus as in A but at a lower SPL (50 dB SPL). (D) ITD function of the neuron in (A,C) to an amplitude-modulated tone with a binaurally beating envelope. Carrier frequency: 990 Hz. Modulation frequency: 160 Hz/161 Hz. Sound intensity: 50 dB SPL. (E,F) Similar to (A), for 2 other mLNTB neurons. Respective stimuli: 400 Hz/401 Hz, 90 dB SPL; 200 Hz/201 Hz, 80 dB SPL; CF, vector strength (VS) and Rayleigh α of ITD tuning are indicated in (A,C–F).

Similar articles

Cited by

References

    1. Adams J. C. (1981). Heavy metal intensification of DAB-based HRP reaction product. J. Histochem. Cytochem. 29:775 10.1177/29.6.7252134 - DOI - PubMed
    1. Adams J. C. (1983). Cytology of periolivary cells and the organization of their projections in the cat. J. Comp. Neurol. 215 275–289. 10.1002/cne.902150304 - DOI - PubMed
    1. Batra R., Kuwada S., Fitzpatrick D. C. (1997). Sensitivity to interaural temporal disparities of low- and high-frequency neurons in the superior olivary complex. II. Coincidence detection. J. Neurophysiol. 78 1237–1247. - PubMed
    1. Berrebi A. S., Spirou G. A. (1998). PEP-19 immunoreactivity in the cochlear nucleus and superior olive of the cat. Neuroscience 83 535–554. 10.1016/S0306-4522(97)00407-7 - DOI - PubMed
    1. Brand A., Behrend O., Marquardt T., McAlpine D., Grothe B. (2002). Precise inhibition is essential for microsecond interaural time difference coding. Nature 417 543–547. 10.1038/417543a - DOI - PubMed

Publication types

LinkOut - more resources