

An alternative mode of CD43 signal transduction activates pro-survival pathways of T lymphocytes
- PMID: 27606486
- PMCID: PMC5341503
- DOI: 10.1111/imm.12670
An alternative mode of CD43 signal transduction activates pro-survival pathways of T lymphocytes
Abstract
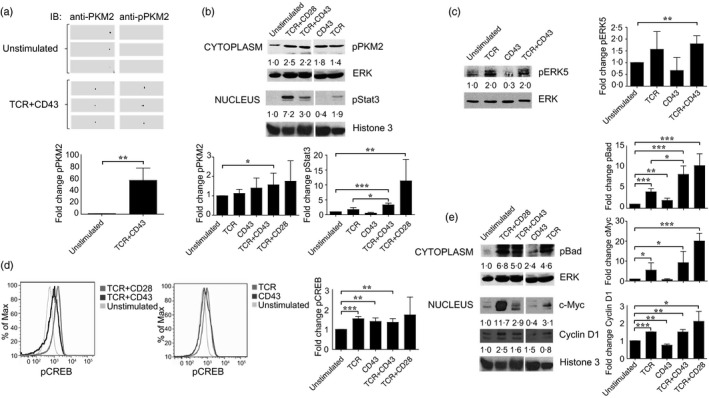
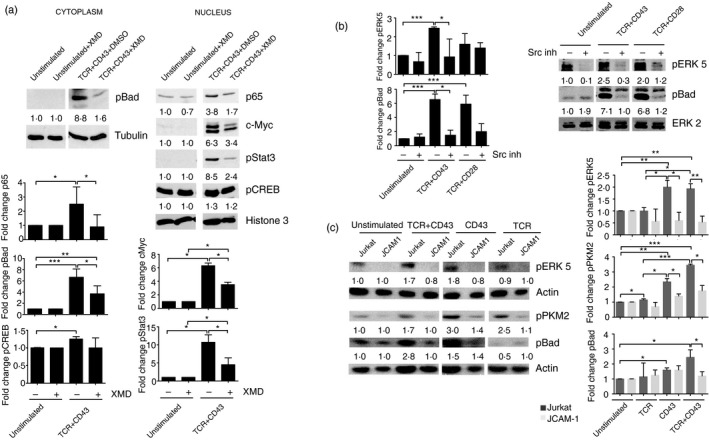
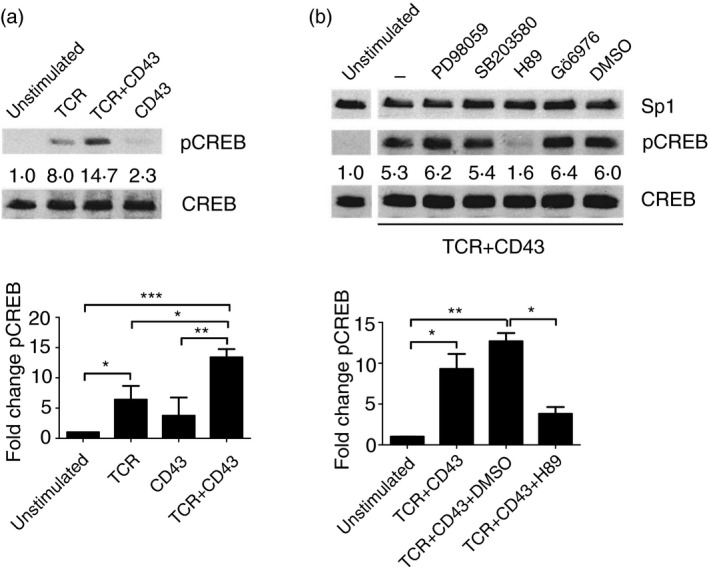
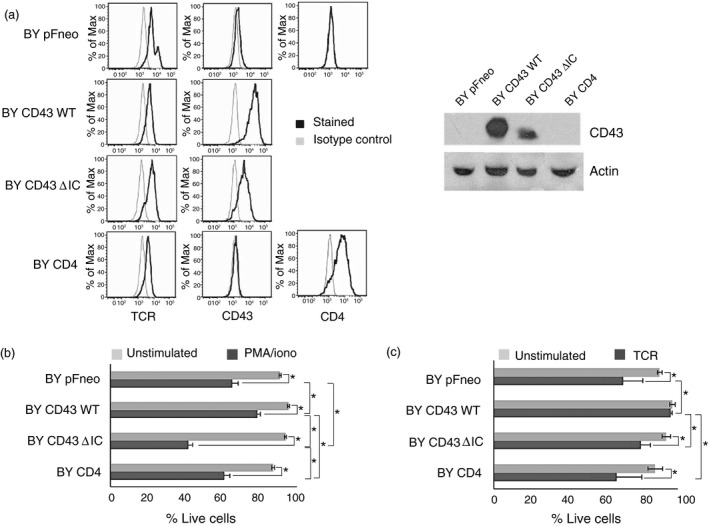
CD43 is one of the most abundant co-stimulatory molecules on a T-cell surface; it transduces activation signals through its cytoplasmic domain, contributing to modulation of the outcome of T-cell responses. The aim of this study was to uncover new signalling pathways regulated by this sialomucin. Analysis of changes in protein abundance allowed us to identify pyruvate kinase isozyme M2 (PKM2), an enzyme of the glycolytic pathway, as an element potentially participating in the signalling cascade resulting from the engagement of CD43 and the T-cell receptor (TCR). We found that the glycolytic activity of this enzyme was not significantly increased in response to TCR+CD43 co-stimulation, but that PKM2 was tyrosine phosphorylated, suggesting that it was performing moonlight functions. We report that phosphorylation of both Y105 of PKM2 and of Y705 of signal transducer and activator of transcription 3 was induced in response to TCR+CD43 co-stimulation, resulting in activation of the mitogen-activated protein kinase kinase 5/extracellular signal-regulated kinase 5 (MEK5/ERK5) pathway. ERK5 and the cAMP response element binding protein (CREB) were activated, and c-Myc and nuclear factor-κB (p65) nuclear localization, as well as Bad phosphorylation, were augmented. Consistent with this, expression of human CD43 in a murine T-cell hybridoma favoured cell survival. Altogether, our data highlight novel signalling pathways for the CD43 molecule in T lymphocytes, and underscore a role for CD43 in promoting cell survival through non-glycolytic functions of metabolic enzymes.
Keywords: CD43; T-cell survival; cAMP response element binding protein signalling; extracellular signal-regulated kinase 5; pyruvate kinase isoform M2.
© 2016 John Wiley & Sons Ltd.
Figures
Similar articles
-
Regulation of Cbl molecular interactions by the co-receptor molecule CD43 in human T cells.J Biol Chem. 2001 Jan 5;276(1):729-37. doi: 10.1074/jbc.M008494200. J Biol Chem. 2001. PMID: 11024037
-
Characterization of a CD43/leukosialin-mediated pathway for inducing apoptosis in human T-lymphoblastoid cells.J Biol Chem. 1996 Nov 1;271(44):27686-95. doi: 10.1074/jbc.271.44.27686. J Biol Chem. 1996. PMID: 8910360
-
TCR-dependent cell response is modulated by the timing of CD43 engagement.J Immunol. 2006 Jun 15;176(12):7346-53. doi: 10.4049/jimmunol.176.12.7346. J Immunol. 2006. PMID: 16751378
-
The MEK5/ERK5 signalling pathway in cancer: a promising novel therapeutic target.Drug Discov Today. 2016 Oct;21(10):1654-1663. doi: 10.1016/j.drudis.2016.06.010. Epub 2016 Jun 16. Drug Discov Today. 2016. PMID: 27320690 Review.
-
MEK5/ERK5 pathway: the first fifteen years.Biochim Biophys Acta. 2012 Jan;1825(1):37-48. doi: 10.1016/j.bbcan.2011.10.002. Epub 2011 Oct 13. Biochim Biophys Acta. 2012. PMID: 22020294 Free PMC article. Review.
Cited by
-
PKM2-dependent metabolic reprogramming in CD4+ T cells is crucial for hyperhomocysteinemia-accelerated atherosclerosis.J Mol Med (Berl). 2018 Jun;96(6):585-600. doi: 10.1007/s00109-018-1645-6. Epub 2018 May 7. J Mol Med (Berl). 2018. PMID: 29732501
-
Chitosan from Crabs (Scylla serrata) Represses Hyperlipidemia-Induced Hepato-Renal Dysfunctions in Rats: Modulation of CD43 and p53 Expression.Pathophysiology. 2021 May 17;28(2):224-237. doi: 10.3390/pathophysiology28020015. Pathophysiology. 2021. PMID: 35366259 Free PMC article.
-
Pyruvate Kinase M2: a Metabolic Bug in Re-Wiring the Tumor Microenvironment.Cancer Microenviron. 2019 Dec;12(2-3):149-167. doi: 10.1007/s12307-019-00226-0. Epub 2019 Jun 10. Cancer Microenviron. 2019. PMID: 31183810 Free PMC article. Review.
-
The glycoimmune checkpoint receptor Siglec-7 interacts with T-cell ligands and regulates T-cell activation.J Biol Chem. 2024 Feb;300(2):105579. doi: 10.1016/j.jbc.2023.105579. Epub 2023 Dec 21. J Biol Chem. 2024. PMID: 38141764 Free PMC article.
-
ESM1 enhances fatty acid synthesis and vascular mimicry in ovarian cancer by utilizing the PKM2-dependent warburg effect within the hypoxic tumor microenvironment.Mol Cancer. 2024 May 8;23(1):94. doi: 10.1186/s12943-024-02009-8. Mol Cancer. 2024. PMID: 38720298 Free PMC article.
References
-
- Mueller DL, Jenkins MK, Schwartz RH. Clonal expansion versus functional clonal inactivation: a costimulatory signalling pathway determines the outcome of T cell antigen receptor occupancy. Annu Rev Immunol 1989; 7:445–80. - PubMed
-
- Fox CJ, Hammerman PS, Thompson CB. Fuel feeds function: energy metabolism and the T‐cell response. Nat Rev Immunol 2005; 5:844–52. - PubMed
-
- Frauwirth KA, Riley JL, Harris MH, Parry RV, Rathmell JC, Plas DR et al The CD28 signaling pathway regulates glucose metabolism. Immunity 2002; 16:769–77. - PubMed
MeSH terms
Substances
LinkOut - more resources
Full Text Sources
Other Literature Sources
Molecular Biology Databases
Research Materials
Miscellaneous
