

A Heat Vulnerability Index: Spatial Patterns of Exposure, Sensitivity and Adaptive Capacity for Santiago de Chile
- PMID: 27606592
- PMCID: PMC5015864
- DOI: 10.1371/journal.pone.0162464
A Heat Vulnerability Index: Spatial Patterns of Exposure, Sensitivity and Adaptive Capacity for Santiago de Chile
Abstract
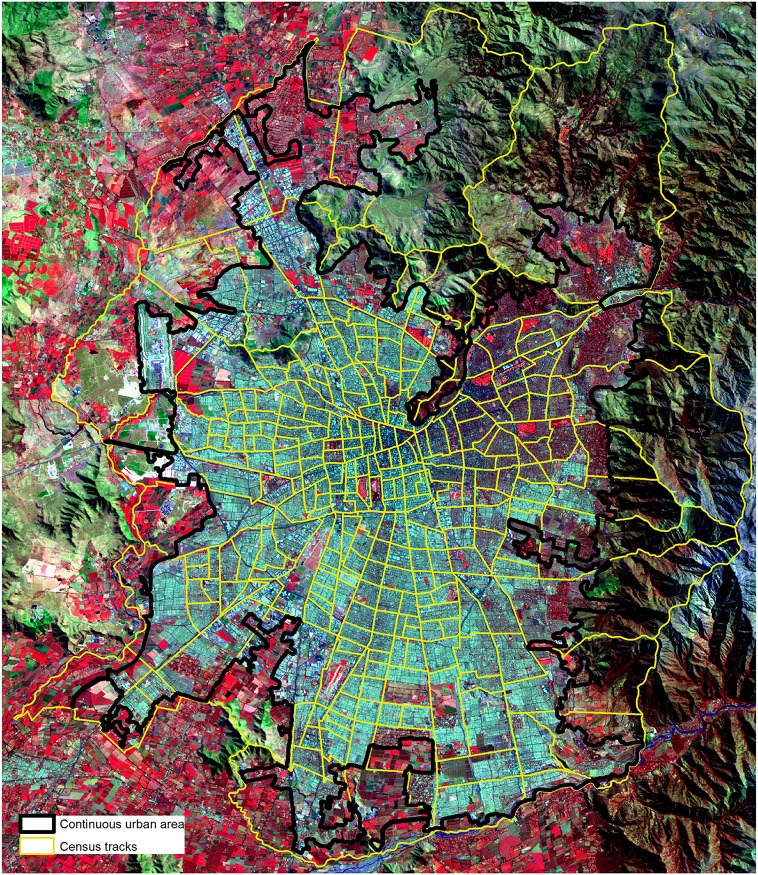
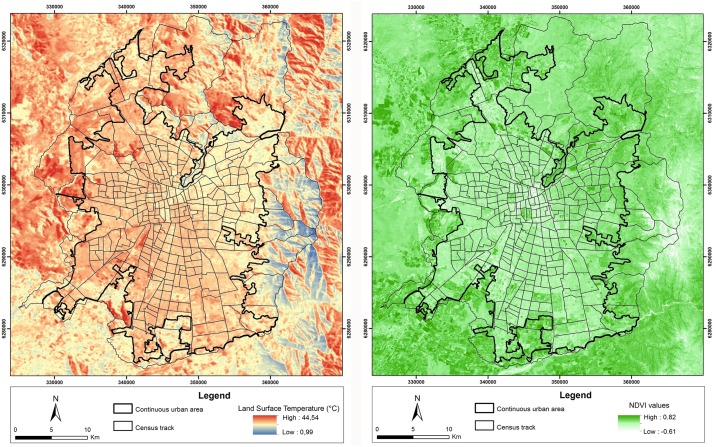
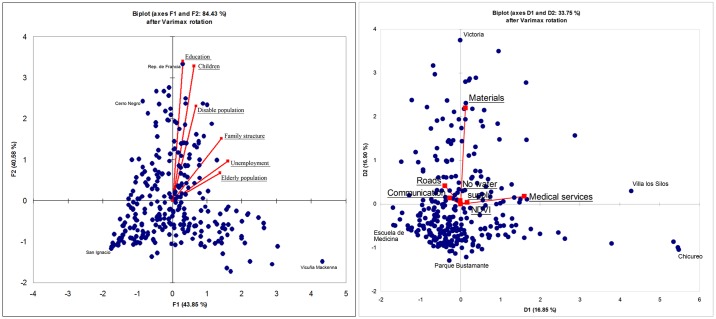
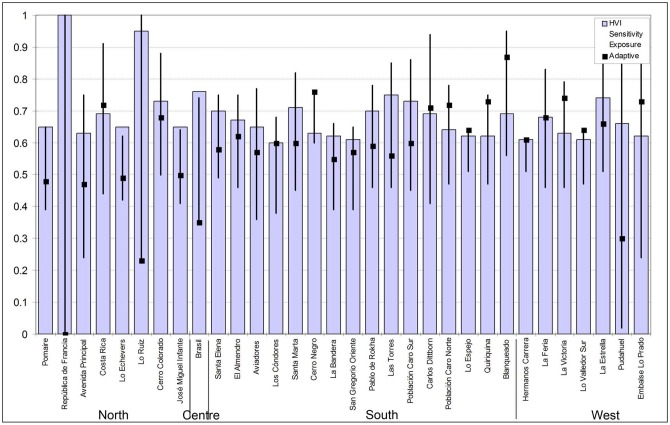
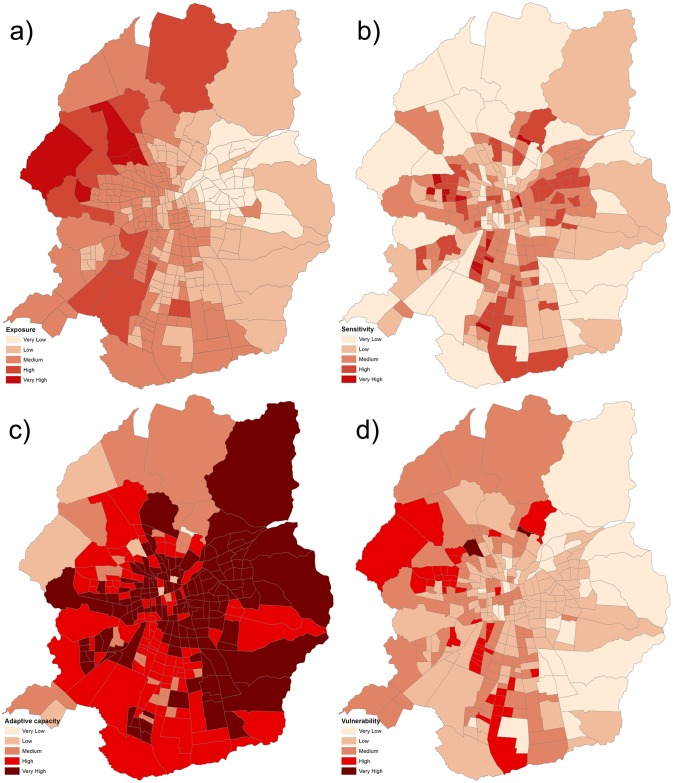
Climate change will worsen the high levels of urban vulnerability in Latin American cities due to specific environmental stressors. Some impacts of climate change, such as high temperatures in urban environments, have not yet been addressed through adaptation strategies, which are based on poorly supported data. These impacts remain outside the scope of urban planning. New spatially explicit approaches that identify highly vulnerable urban areas and include specific adaptation requirements are needed in current urban planning practices to cope with heat hazards. In this paper, a heat vulnerability index is proposed for Santiago, Chile. The index was created using a GIS-based spatial information system and was constructed from spatially explicit indexes for exposure, sensitivity and adaptive capacity levels derived from remote sensing data and socio-economic information assessed via principal component analysis (PCA). The objective of this study is to determine the levels of heat vulnerability at local scales by providing insights into these indexes at the intra city scale. The results reveal a spatial pattern of heat vulnerability with strong variations among individual spatial indexes. While exposure and adaptive capacities depict a clear spatial pattern, sensitivity follows a complex spatial distribution. These conditions change when examining PCA results, showing that sensitivity is more robust than exposure and adaptive capacity. These indexes can be used both for urban planning purposes and for proposing specific policies and measures that can help minimize heat hazards in highly dynamic urban areas. The proposed methodology can be applied to other Latin American cities to support policy making.
Conflict of interest statement
The authors have declared that no competing interests exist.
Figures
Similar articles
-
Urban heat vulnerability: A dynamic assessment using multi-source data in coastal metropolis of Southeast China.Front Public Health. 2022 Oct 20;10:989963. doi: 10.3389/fpubh.2022.989963. eCollection 2022. Front Public Health. 2022. PMID: 36339225 Free PMC article.
-
Geospatial indicators of exposure, sensitivity, and adaptive capacity to assess neighbourhood variation in vulnerability to climate change-related health hazards.Environ Health. 2021 Mar 22;20(1):31. doi: 10.1186/s12940-021-00708-z. Environ Health. 2021. PMID: 33752667 Free PMC article.
-
A Heat Vulnerability Index: Spatial Patterns of Exposure, Sensitivity and Adaptive Capacity for Urbanites of Four Cities of India.Int J Environ Res Public Health. 2021 Dec 28;19(1):283. doi: 10.3390/ijerph19010283. Int J Environ Res Public Health. 2021. PMID: 35010542 Free PMC article.
-
Emerging climate change-related public health challenges in Africa: A case study of the heat-health vulnerability of informal settlement residents in Dar es Salaam, Tanzania.Sci Total Environ. 2020 Dec 10;747:141355. doi: 10.1016/j.scitotenv.2020.141355. Epub 2020 Jul 29. Sci Total Environ. 2020. PMID: 32777515 Review.
-
Spatially explicit assessment of heat health risk by using multi-sensor remote sensing images and socioeconomic data in Yangtze River Delta, China.Int J Health Geogr. 2018 May 25;17(1):15. doi: 10.1186/s12942-018-0135-y. Int J Health Geogr. 2018. PMID: 29801488 Free PMC article.
Cited by
-
Mapping Heat-Related Risks in Northern Jiangxi Province of China Based on Two Spatial Assessment Frameworks Approaches.Int J Environ Res Public Health. 2020 Sep 10;17(18):6584. doi: 10.3390/ijerph17186584. Int J Environ Res Public Health. 2020. PMID: 32927631 Free PMC article.
-
Elucidating Uncertainty in Heat Vulnerability Mapping: Perspectives on Impact Variables and Modeling Approaches.Int J Environ Res Public Health. 2024 Jun 21;21(7):815. doi: 10.3390/ijerph21070815. Int J Environ Res Public Health. 2024. PMID: 39063393 Free PMC article.
-
Appraisal of the heat vulnerability index in Punjab: a case study of spatial pattern for exposure, sensitivity, and adaptive capacity in megacity Lahore, Pakistan.Int J Biometeorol. 2019 Dec;63(12):1669-1682. doi: 10.1007/s00484-019-01784-0. Epub 2019 Aug 24. Int J Biometeorol. 2019. PMID: 31446482
-
Characteristics of Households' Vulnerability to Extreme Heat: An Analytical Cross-Sectional Study from India.Int J Environ Res Public Health. 2022 Nov 20;19(22):15334. doi: 10.3390/ijerph192215334. Int J Environ Res Public Health. 2022. PMID: 36430053 Free PMC article.
-
A low-carbon electricity sector in Europe risks sustaining regional inequalities in benefits and vulnerabilities.Nat Commun. 2023 Apr 18;14(1):2205. doi: 10.1038/s41467-023-37946-3. Nat Commun. 2023. PMID: 37072436 Free PMC article.
References
-
- Sabatini F, Wormald G, Sierralta C, Peters PA. Residential Segregation in Santiago: Scale-Related Effects and Trends, 1992–2002. Urban Segregation and Governance in the Americas. 2009. April 27:121.
-
- Inostroza L. Informal urban development in Latin American urban peripheries. Spatial assessment in Bogotá, Lima and Santiago de Chile. Landscape and Urban Planning. 2016. in press; 10.1016/j.landurbplan.2016.03.021 - DOI
-
- Inostroza L. Climate change adaptation responses in Latin American urban areas. Challenges for Santiago de Chile and Lima In “Cambio climatico: leccciones de y para ciudades de America latina”, 2016. Nail Ed., Universidad Externado de Colombia, 391–420. ISBN 978-958-772-479-0.
-
- Baum S, Horton S, Low Choy D, Gleeson B. Climate change, health impacts and urban adaptability: case study of Gold Coast City. Research Monograph. 2009. February;11:68 Available: http://www.griffith.edu.au/__data/assets/pdf_file/0011/119864/urp-rm11-b...
MeSH terms
LinkOut - more resources
Full Text Sources
Other Literature Sources
