. 2016 Sep 8;12(9):e1005835.
doi: 10.1371/journal.ppat.1005835. eCollection 2016 Sep.

The Structural Architecture of an Infectious Mammalian Prion Using Electron Cryomicroscopy

Affiliations

The Structural Architecture of an Infectious Mammalian Prion Using Electron Cryomicroscopy

Ester Vázquez-Fernández et al. PLoS Pathog. .

Abstract

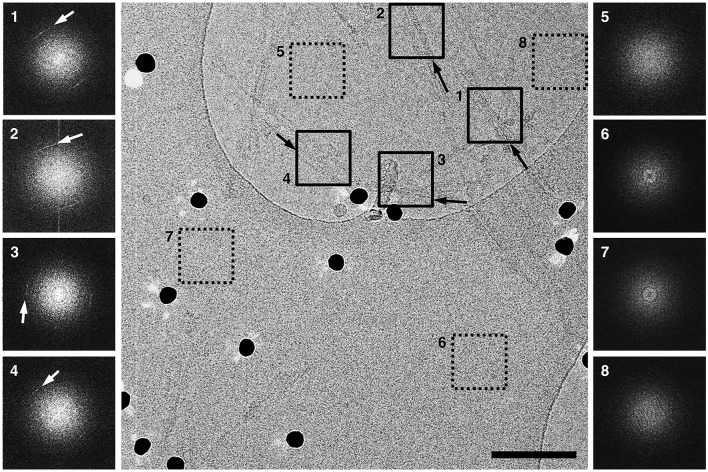
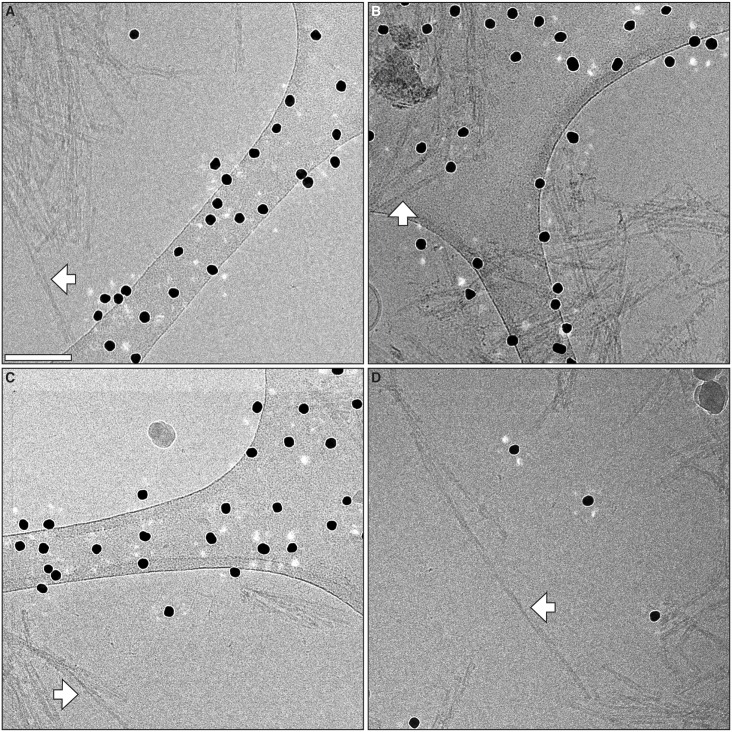
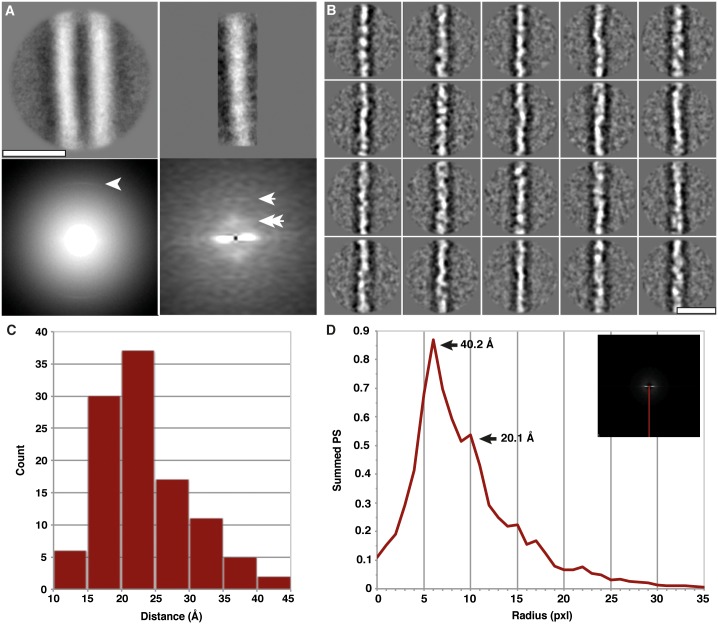
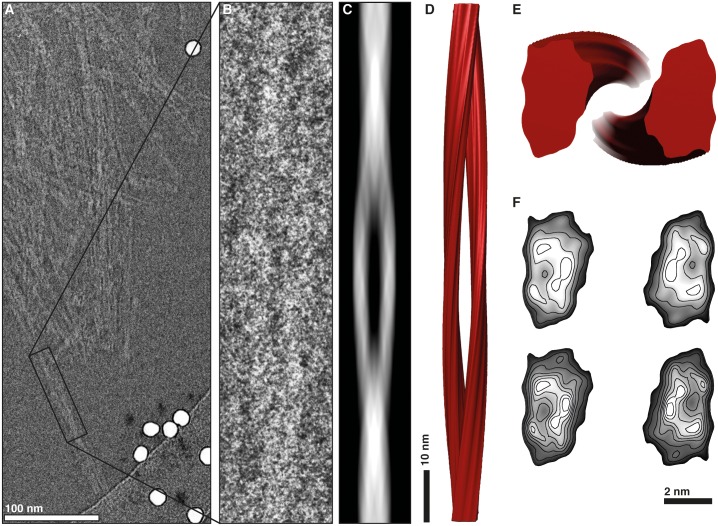
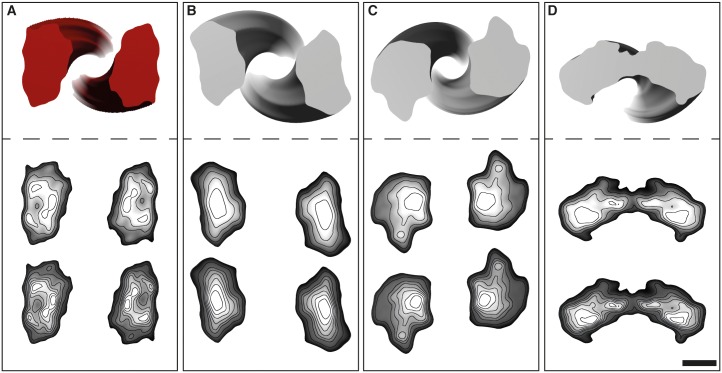
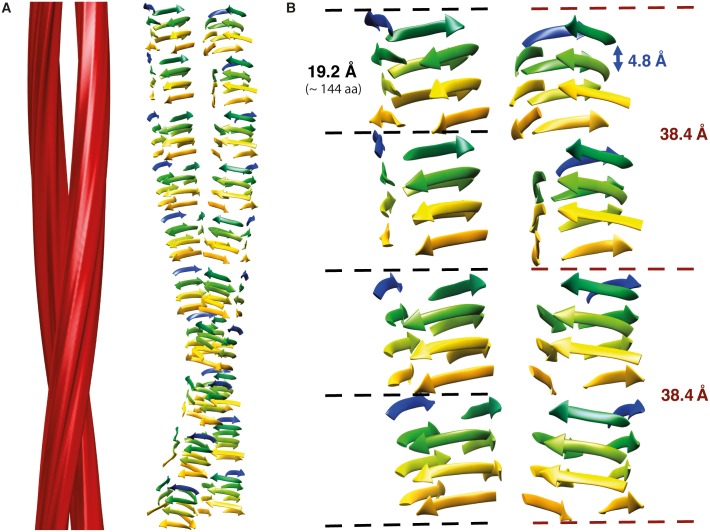
The structure of the infectious prion protein (PrPSc), which is responsible for Creutzfeldt-Jakob disease in humans and bovine spongiform encephalopathy, has escaped all attempts at elucidation due to its insolubility and propensity to aggregate. PrPSc replicates by converting the non-infectious, cellular prion protein (PrPC) into the misfolded, infectious conformer through an unknown mechanism. PrPSc and its N-terminally truncated variant, PrP 27-30, aggregate into amorphous aggregates, 2D crystals, and amyloid fibrils. The structure of these infectious conformers is essential to understanding prion replication and the development of structure-based therapeutic interventions. Here we used the repetitive organization inherent to GPI-anchorless PrP 27-30 amyloid fibrils to analyze their structure via electron cryomicroscopy. Fourier-transform analyses of averaged fibril segments indicate a repeating unit of 19.1 Å. 3D reconstructions of these fibrils revealed two distinct protofilaments, and, together with a molecular volume of 18,990 Å3, predicted the height of each PrP 27-30 molecule as ~17.7 Å. Together, the data indicate a four-rung β-solenoid structure as a key feature for the architecture of infectious mammalian prions. Furthermore, they allow to formulate a molecular mechanism for the replication of prions. Knowledge of the prion structure will provide important insights into the self-propagation mechanisms of protein misfolding.


Conflict of interest statement

MRV is an employee of FEI Company (Eindhoven, The Netherlands), this does not alter our adherence to all PLoS Pathogens policies on sharing data and materials.

Figures

Fig 1
Fig 1. Characterization of GPI-anchorless prions.
(A) SYPRO Ruby-stained 15% SDS-PAGE of purified GPI-anchorless PrP 27–30. The molecular mass of the purified peptide (residues 89–232) is 17,148 Da. The doublet seen at ~17 kDa reflects the presence of PK-resistant fragments of slightly different sizes (“ragged ends” [18]). Faint bands of ~34 kDa are characteristic dimers, the result of an incomplete dissociation of PrP 27–30 fibrils. Minor impurities correspond to traces of ferritin, tubulin and collagen [23], which are clearly recognizable in electron micrographs. (B) Western blot of: Lanes 1–2, RML-infected WT mouse brain homogenate (BH), ± PK digestion. WT PrP presents as three characteristic bands of di-, mono-, and unglycosylated protein, respectively. Lanes 3–4, RML-infected GPI-anchorless PrP transgenic mouse BH, ± PK digestion; lane 5, purified GPI-anchorless PrP 27–30, used for cryo-EM studies; the 10–15 kDa band corresponds to a minor population of N-terminally truncated PK-resistant fragments described by Vázquez-Fernández et al. [18]; lanes 6–7, WT mouse BH inoculated with purified GPI-anchorless PrP 27–30, ± PK digestion. (C) Kaplan-Meier survival analysis of: WT mice infected with GPI-anchorless PrPSc BH (red), survival time 153 ± 10 days (standard deviation); WT mice infected with purified GPI-anchorless PrP 27–30 (green), survival time 203 ± 9 days (standard deviation); WT mice inoculated with PBS as negative control (blue) (n = 6, P < 0.05, Gehan-Breslow-Wilcoxon test).
Fig 2
Fig 2. Histopathological and immunohistochemical analyses.
Brain tissue sections of the thalamus: one section was stained with hematoxylin and eosin (H&E, left), two others were analyzed via immunohistochemistry (IHC) using the anti-PrP antibody 2G11 (middle) and an antibody against the glial fibrillary acidic protein (GFAP) to reveal astroglial activation (right). Control WT mice inoculated with PBS (first row); WT mice infected with RML prions (second row); and transgenic mice expressing GPI-anchorless PrP infected with RML prions (third row). Black arrowheads indicate the presence of hyaline deposits, which stain PrP angiocentric plaques. WT mice infected with GPI-anchorless PrPSc BH (fourth row); and WT mice infected with purified GPI-anchorless PrP 27–30 (fifth row).
Fig 3
Fig 3. Raw cryo-EM images of GPI-anchorless prion fibrils show their basic features and 4.8 Å cross-β signals.
A high-resolution cryo-EM image showing individual GPI-anchorless PrP 27–30 fibrils or small bundles of fibrils (solid boxes). Fourier-transform (FT) analyses from the corresponding boxes show 4.8 Å cross-ß signals that originate from the ß-strand stacking along the fibril axis and which follow the orientation of the fibrils (black and white arrows). FT analyses of areas of ice or carbon film, that were devoid of amyloid fibrils (dotted boxes), and which did not show any noticeable signals at 4.8 Å. Scale bar, 100 nm.
Fig 4
Fig 4. Additional cryo-EM micrographs of GPI-anchorless prion fibrils.
Electron micrographs showing representative GPI-anchorless prion fibrils, including four isolated fibrils that were subsequently analyzed by image processing (white arrows). The labels (A to D) correspond to the lettering in the 3D fibril reconstruction figures (vide infra). Black dots originate from fiducial gold that was added for tomographic studies. Scale bar, 100 nm.
Fig 5
Fig 5. Single particle averaging of GPI-anchorless PrP 27–30 fibril images.
(A) Average from 1072 fibril segments (top left) and the logarithm of their summed power spectrum (bottom left). The arrowhead indicates the characteristic 4.8 Å cross-β signal. Representative 2D class average of 100 single protofilaments (top right) and their averaged Fourier-transform (bottom right). Single and double arrows are pointing to intensities at 19.1 Å (single pixel) and ~40 Å (38.3 Å and 44.6 Å pixels), respectively. (B) Gallery of 2D class averages obtained from reference-free analysis of individual protofilaments. Box size is 150 by 150 pixels, equivalent to 20.1 by 20.1 nm. (C) Histogram of manually determined sizes of densities along the protofilament from the class averages in (B). The majority of densities fall into the classes between 15 and 25 Å. (D) The average over all amplitude spectra of all class averages. A plot of the meridian of the Fourier-transform (red line) reveals a broad peak around 40.2 Å and a smaller peak at 20.1 Å (arrows). The Nyquist frequency (2.68 Å) corresponds with the 75 pixel outer border of the spectra. Scale bars, 10 nm.
Fig 6
Fig 6. 3D reconstruction of a GPI-anchorless prion fibril.
(A) Section of an electron micrograph showing GPI-anchorless prion fibrils. The single isolated and twisted fibril used for the 3D reconstruction is enclosed by a black box. (B) Close-up view of the prion fibril. (C) Re-projected image of the 3D fibril map. (D) Reconstruction of the GPI-anchorless prion fibril. (E) Cross-section of the reconstructed fibril. (F) Contoured density maps of the cross-sections. Lines are contoured at increasing levels of 0.25 σ and 0.125 σ (top and bottom, respectively).
Fig 7
Fig 7. Cross-sections and density contour plots.
Cross-sections from the four single GPI-anchorless prion fibrils that were analyzed (top). Contoured density lines from the cross-sections of the 3D maps in the yz plane (bottom). Density maps are contoured at increasing levels of 0.25 σ and 0.125 σ (top and bottom, respectively). Labels from (AD) are in concordance with Figs 4 and S9. Scale bar, 2 nm.
Fig 8
Fig 8. A GPI-anchorless PrP 27–30 fibril and its structural outline.
(A) 3D reconstruction of an individual GPI-anchorless PrP 27–30 fibril with two protofilaments (left). Cartoon depicting the potential configuration of the polypeptide chains in the PrP 27–30 monomers (right). Please note that this is NOT an atomistic model for the structure of PrPSc. (B) Close up view of the possible ß-sheet stacking in a four-rung ß-solenoid structure for illustration purposes only. Different colors represent different ß-solenoid rungs. Characteristic distances of the four-rung ß-solenoid architecture are labeled. One critical constraint for the threading of the PrP sequence into a four-rung solenoid is accommodating the disulfide bridge between cysteines 179 and 214, which is known to be preserved in PrPSc. As in a model of the insulin amyloid, also proposed to be solenoid-like, the two cysteines might be located in register, in corners of two consecutive rungs, with the disulfide bond parallel to the protofilament axis [31,34].

References

    1. Colby D.W., and Prusiner S.B. (2011). Prions. Cold Spring Harb Perspect Biol 3, a006833 10.1101/cshperspect.a006833 - DOI - PMC - PubMed
    1. Riek R., Hornemann S., Wider G., Billeter M., Glockshuber R., and Wüthrich K. (1996). NMR structure of the mouse prion protein domain PrP(121–231). Nature 382, 180–182. - PubMed
    1. Knaus K.J., Morillas M., Swietnicki W., Malone M., Surewicz W.K., and Yee V.C. (2001). Crystal structure of the human prion protein reveals a mechanism for oligomerization. Nat. Struct. Biol. 8, 770–774. - PubMed
    1. Smirnovas V., Baron G.S., Offerdahl D.K., Raymond G.J., Caughey B., and Surewicz W.K. (2011). Structural organization of brain-derived mammalian prions examined by hydrogen-deuterium exchange. Nat. Struct. Mol. Biol. 18, 504–506. 10.1038/nsmb.2035 - DOI - PMC - PubMed
    1. Requena J.R., and Wille H. (2014). The structure of the infectious prion protein: Experimental data and molecular models. Prion 8, 60–66. - PMC - PubMed

Publication types

MeSH terms